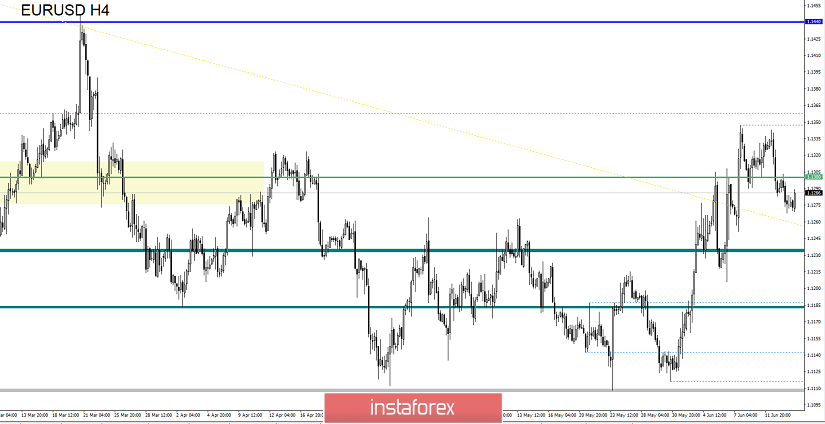
For the last trading day, the euro / dollar currency pair showed an underestimated volatility of 35 points. However, this is already enough to send a quote to the control point. From the point of view of technical analysis, we see that the quotation, forming a recovery movement, has already managed to overcome the level of 1.1300, while maintaining a downward interest. Now the focus of traders next coordinates 1.1265, which reflects the earlier accumulation and a possible point of support and a turning point of the trend. In previous reviews, we have already developed the theory that there are prerequisites for a change in the long-term downward trend. The quotation now needs to find a foothold in the values of 1.1300-1.1265, so that there will be a gain and a new round of momentum. Of course, this is only a discussion for now. However, I think everything will fall into place in the near future.
We turn to the news background of the previous day, and what we see is practically nothing when it comes to statistical data. Published data on industrial production in Europe has an insignificant increase, which is not even displayed on the trading chart. In the United States, data were published with a number of initial claims for unemployment benefits, where a slight increase from 219K to 222K was shown. The reason for the strengthening of the dollar and amplitude fluctuation comes from the great uncertainty associated with the UK & EU divorce process, where we currently have elections in Britain which will take place for the Conceptive Party leader. This is also superimposed on the trading schedule.
Today, in terms of the economic calendar, we have data on retail sales in the United States, where growth is expected from 3.1% to 3.4%. At the same time, data on industrial production in the United States will be published, where growth from 0.9% to 2.5% is also expected.
The upcoming trading week in terms of the economic calendar is quite saturated. We have a Fed meeting and a pretty good array of statistics. The most interesting events are displayed below --->
Tuesday, June 18
EU 9:00 UTC+00 - Consumer Price Index (CPI) (y / y) (May): Prev. 1.2%
United States 12:30 UTC+00 - Number of building permits issued (May): Prev. 1.290M ---> Forecast 1,300M
United States 12:30 UTC+00 - The volume of construction of new homes (May): Prev. 1,235M ---> Forecast of 1,240M
Wednesday, June 19
15:30 UTC+00 - Fed meeting followed by FOMC press conference
Thursday, June 20
United States 12:00 UTC+00 - The number of initial claims for unemployment benefits
Friday, June 21
EU 08:00 UTC+00 - Manufacturing Business Index (PMI) (June): Prev. 47.7 ---> Forecast 48.1
United States 14:00 UTC+00 - Sales in the secondary housing market (May): Prev. 5.19M ---> Forecast 5.24M
These are preliminary and subject to change.
Further development
Analyzing the current trading chart, we see that the quotation has come closer to the control point in the face of the level of 1.1265, where it felt a foothold and slowed down. Now, it is worth looking at the behavior of the quotes, how strong will the rollback or stagnation. Particular attention is paid to the point of fixation, if there will be a breakdown of the level at which the main trend will resume.
Based on the available information, it is possible to decompose a number of variations, let's consider them:
- Purchase items are considered higher than 1.1310.
- Sell positions are considered lower than 1.1260.
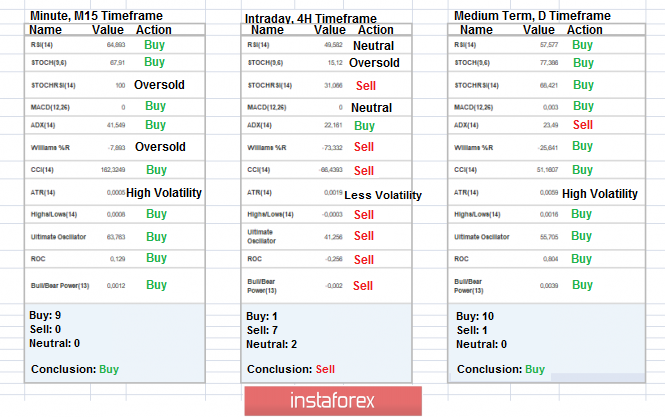
Indicator Analysis
Analyzing a different sector of timeframes (TF), we see that the indicators in the short term are aimed at climbing, due to the primary level testing. Intraday perspective maintains downward interest. The medium-term perspective, in turn, holds upward interest against the background of the earlier move.
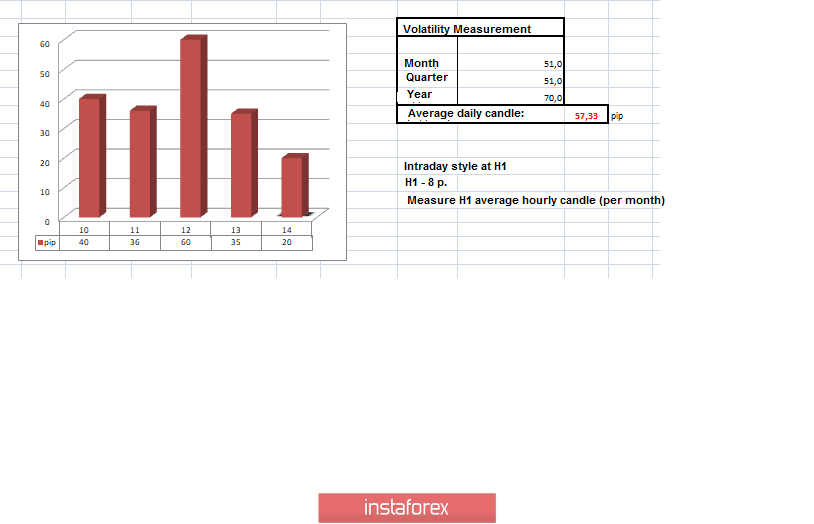
Weekly volatility / Measurement of volatility: Month; Quarter; Year
Measurement of volatility reflects the average daily fluctuation, based on monthly / quarterly / year.
(June 14 was based on the time of publication of the article)
The current time volatility is 20 points. Volatility can still accelerate, if, of course, there is no stagnation within the value of 1.1265.
Key levels
Zones of resistance: 1.1300 **; 1.1440; 1.1550; 1.1650 *; 1.1720 **; 1.1850 **; 1.2100
Support areas: 1.1180; 1.1112; 1.1080 *; 1.1000 ***; 1,0850 **
* Periodic level
** Range Level