4-hour timeframe
Technical data:
The upper channel of linear regression: direction – down.
The lower channel of linear regression: direction – down.
The moving average (20; smoothed) – down.
CCI: -117.4390
Yesterday can be called a failure for the euro. We already wrote in yesterday's article about the indices of business activity in the European Union and Germany, which all, as one, failed. It remains only to mention the speech of ECB President Mario Draghi before the European Parliament. We have repeatedly said that even for Draghi's neutral rhetoric, there are no fundamental factors. Therefore, each speech of the ECB Chairman potentially carries a danger to the euro. That's what happened yesterday. Mario Draghi's speech was ultra-soft. He said that European macroeconomic indicators have slowed more than expected, that there are no signs of economic recovery, low inflation remains a headache for the ECB. In this regard, the regulator will continue to "keep abreast" with the willingness to further soften monetary policy. Draghi also noted that "the longer the recession persists in the industry, the higher the probability that the "crisis" will affect other areas." The European currency paired with the US dollar only miraculously did not react to these words, as well as no stronger than expected business activity indices in the sphere of production and services of the United States. In general, Draghi did not surprise the markets, he only said that there are no positive changes. Now, for a new rate cut, Draghi has only one chance – the October meeting of the regulator, after which the head of the ECB will transfer his powers to Christine Lagarde and resign.
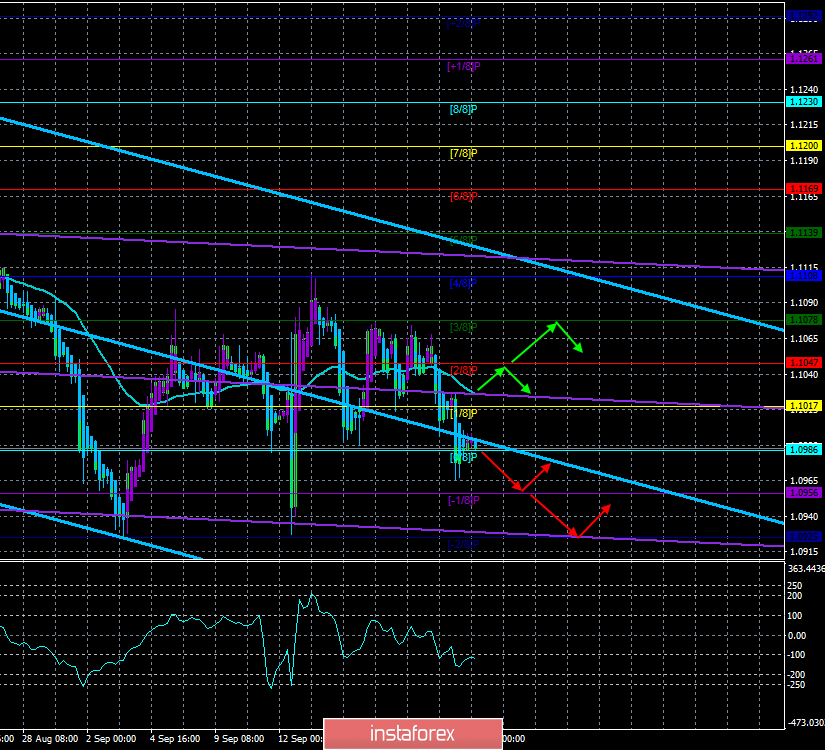
Tuesday, September 24th, will be a calmer day than Monday. At least, the euro would like to hope so. Today, no important macroeconomic publications are planned in the European Union, and only the level of consumer confidence will be released in the States. However, yesterday, traders received a "charge" for the whole week and today, they can calmly continue to get rid of the euro. Ghostly chances that the pair will still form an upward trend in the near future remain. Still, the pattern of "double bottom" has not yet been canceled, but now every trader can personally observe the continuous flow of negativity from the eurozone. In favor of the further fall of the euro/dollar pair, both channels of linear regression speak, which are directed downward, indicating a downward trend in the medium and long term, as well as the fact that each subsequent maximum is lower than the previous one. In general, the euro is still balancing on the brink of the abyss and, perhaps, only the reluctance of bears to rush into battle with new forces around the two-year lows of the pair, somehow still restrains the currency pair from new falls. Based on the current technical picture, it follows that the "bearish" mood remains in the forex market, and there are very few chances for the formation of an upward trend now.
Nearest support levels:
S1 – 1.0986
S2 – 1.0956
S3 – 1.0925
Nearest resistance levels:
R1 – 1.1017
R2 – 1.1047
R3 – 1.1078
Trading recommendations:
The euro/dollar pair consolidated below the moving average and worked out Murray's level of "1/8" - 1.0986. Thus, we recommend resuming trading on the fall with the targets of 1.0986, 1.0956 and 1.0925, after the reversal of the Heiken Ashi indicator down. Eurocurrency purchases are currently not recommended.
In addition to the technical picture, fundamental data and the time of their release should also be taken into account.
Explanation of illustrations:
The upper linear regression channel – the blue line of the unidirectional movement.
The lower linear regression channel – the purple line of the unidirectional movement.
CCI – the blue line in the indicator window.
The moving average (20; smoothed) – the blue line on the price chart.
Support and resistance – red horizontal lines.
Heiken Ashi – an indicator that colors bars in blue or purple.