يحتوي هذا القسم على أهم المعلومات حول التداول مع إنستافوركس. نحن نقدم كلاً من التحليل من كبار الخبراء للمتداولين ذوي الخبرة والمقالات حول ظروف التداول للمبتدئين. ستساعد خدماتنا في زيادة أرباحك المحتملة.
هذا القسم مصمم لأولئك الذين بدأوا للتو رحلة تداولهم. ستلبي المواد التعليمية والتحليلية المقدمة من قبل إنستافوركس احتياجاتك التدريبية. ستجعل توصيات خبرائنا خطواتك الأولى نحو نجاح التداول بسيطة وواضحة.
تعد خدمات إنستافوركس المبتكرة عنصرًا أساسيًا في الاستثمار الإنتاجي. نحن نسعى جاهدين لتزويد عملائنا بقدرات تقنية متقدمة وجعل روتين التداول الخاص بهم مريحًا حيث إننا معترف بنا كأفضل وسيط في هذا الصدد.
الشراكة مع إنستافوركس مفيدة ورفيعة المستوى. انضم إلى برامج الشراكة الخاصة بنا واحصل على مكافآت وعمولات وفرصة للسفر مع فريق العلامة التجارية المشهورة عالميًا.
هذا القسم يحتوي على العروض الأكثر ربحًا من إنستافوركس. احصل على البونصات عند تعبئة الحساب ، وتنافس مع المتداولين الآخرين ، واحصل على جوائز حقيقية حتى عند التداول في حساب تجريبي.
العطلات مع إنستافوركس ليست ممتعة فقط ولكنها مفيدة أيضًا. نحن نقدم بوابة شاملة والعديد من المنتديات ومدونات الشركات ، حيث يمكن للمتداولين تبادل الخبرات والاندماج بنجاح في مجتمع الفوركس.
إنستافوركس هي علامة تجارية دولية تم إنشاؤها في عام 2007. تقدم الشركة الخدمات في مجال تداول الفوركس عبر الإنترنت وهي معترف بها كواحدة من شركات الوساطة الرائدة في العالم. لقد فزنا بثقة أكثر من 7,000,000 من متداولي التجزئة الذين أعربوا بالفعل عن تقديرهم لموثوقيتنا وتركيزنا على الابتكارات.
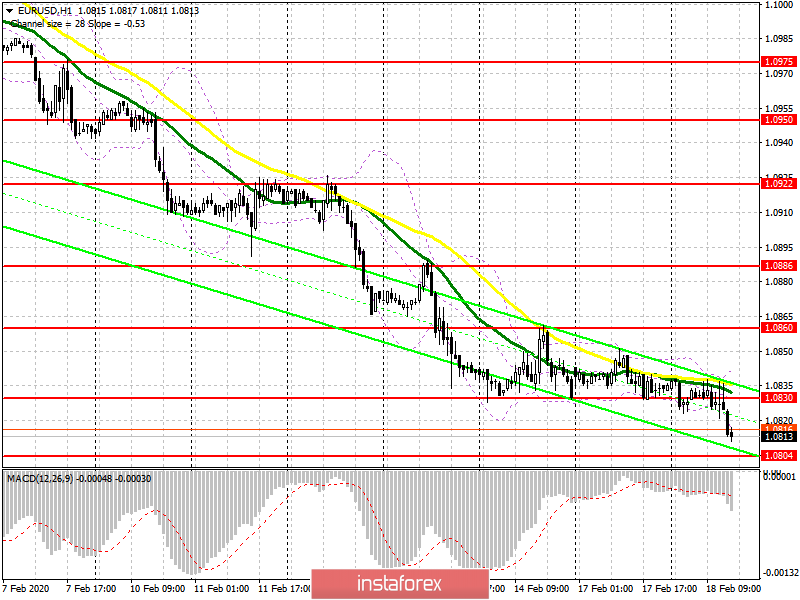
EUR/USD: plan for the US session on February 18. The latest data on the eurozone pushes the euro down. The nearest target is the levels of 1.0800 and 1.0770
The bulls failed to hold the level of 1.0830 in the first half of the day after reports indicating a faster deterioration in business sentiment in Germany and the eurozone. Now there is no news that allows you to expect even a small upward correction in the pair. Most likely, the bulls will show activity in the support area of 1.0804. However, a more suitable target for opening long positions is still a minimum of 1.0773. I recommend making purchases from 1.0804 only if a false breakdown is formed. It is not an unimportant task for the bulls to return to the resistance of 1.0830, since only after this can we expect an upward correction to the area of the highs of 1.0860 and 1.0886, where I recommend fixing the profits. Given that important fundamental statistics are not published in the second half of the day, it is likely that the pressure on the euro will continue.
To open short positions on EURUSD, you need:
Bears continue to bend their line, and weak fundamental data on the state of the European economy helps them in this. Having achieved a return under the support of 1.0830 in the first half of the day, sellers without the slightest doubt continued to push the euro on the trend. The next target is a minimum of 1.0804, which is unlikely to stop the bears. A further task is to test the support range of 1.0773, where I recommend fixing the profits. In the scenario of an upward correction, which is unlikely to be possible without good data, short positions can be considered if a false breakdown is formed in the resistance area of 1.0830 and it is best to open short positions immediately for a rebound from the maximum of 1.0860.
Signals of indicators:
Moving averages
Trading is conducted below the 30 and 50 moving averages, which indicates a further bearish trend in the euro.
Bollinger Bands
In the case of an upward correction in the second half of the day, the upper limit of the indicator around 1.0840 will act as a resistance.
Description of indicators
Moving average (moving average determines the current trend by smoothing out volatility and noise). Period 50. The graph is marked in yellow.
Moving average (moving average determines the current trend by smoothing out volatility and noise). Period 30. The graph is marked in green.
MACD indicator (Moving Average Convergence / Divergence - moving average convergence / divergence) Fast EMA period 12. Slow EMA period 26. SMA period 9
Bollinger Bands (Bollinger Bands). Period 20
لقد أعجبك هذا المنشور بالفعل اليوم
*The market analysis posted here is meant to increase your awareness, but not to give instructions to make a trade.
قم بإيداع 3,000 دولار في حسابك واحصل على $1,000 وأكثر من ذالك! في أبريل نحن نقدم باليانصيب $1,000 ضمن حملة إيداع الحظ! احصل على فرصة للفوز من خلال إيداع 3,000 دولار في حساب تداول. بعد أن استوفيت هذا الشرط، تصبح مشاركًا في الحملة.