Before proceeding to the traditional consideration of the price charts of the GBP/USD currency pair, let's talk about the topic of the relationship between Brussels and London after the UK leaves the European Union. According to David Frost, who oversees all issues related to Brexit, one of the most important points on the customs movement of goods and products from the UK to Northern Ireland is still far from being resolved. In this regard, it is possible that the British side may resort to the application of Article 16. However, according to Brexit Minister Frost, London will use all possible options to reach a consensus with the European Union on this and some other controversial issues. At the moment, after the divorce process, called "Brexit", there are contradictions and disagreements, which was quite predictable. In divorce proceedings, this always happens, so there is nothing to be surprised about. President Macron is also dissatisfied with the relationship between Great Britain and France, who believes that London is disrespectful to the issue of a fishing license. At the moment, the situation in this area is not actually solved. France calls on the European Commission to provide its more substantial assistance in reaching a compromise with the British side.
There will be no overly significant and important events coming from the UK this week. It can only be noted that the speech of the head of the Bank of England, Andrew Bailey, will take place this Thursday, at 19:00 London time. From macroeconomic reports, I recommend paying attention to the PMI manufacturing activity index, which will be published tomorrow at 09:30 (London time). It's time to move on to technical analysis, and let's see how the GBP/USD currency pair finished trading last week.
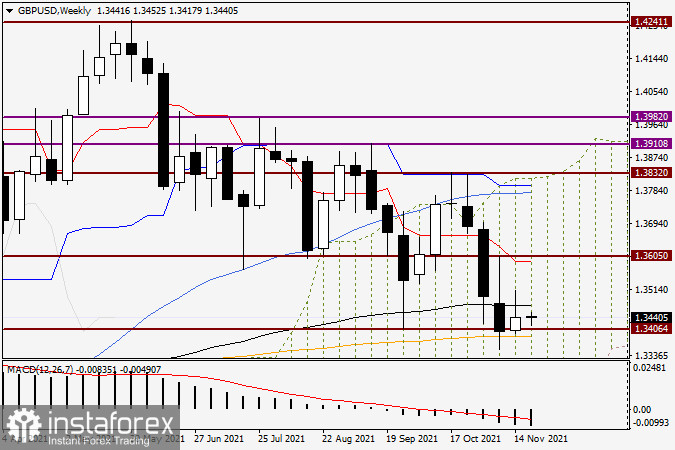
Weekly
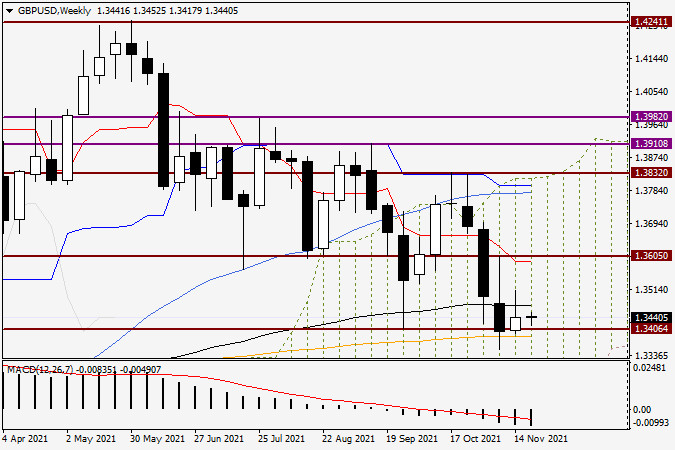
Unlike the single European currency, the British pound showed an increase against the US dollar at the November 15-19 auction. However, the strengthening of the "British" was quite insignificant, and the long upper shadow of the last weekly candle, with the closing price below the black 89 exponential moving average, leaves more questions than answers about the further direction of the course. A characteristic and important point can be considered the strong support provided to the pair by the far from weak technical level of 1.3400. If anyone remembers, in previous articles on GBP/USD, this mark was repeatedly mentioned as one of the key ones, and it was assumed that it could contain the pressure of bears on the pound. That's exactly what happened. Undoubtedly, it is worth noting the orange 200 exponential moving average, which runs at 1.3387 and also restrains the pressure of sellers. In general, the situation on the weekly chart is far from unambiguous. Let's see what kind of technical picture is observed in a smaller time interval.
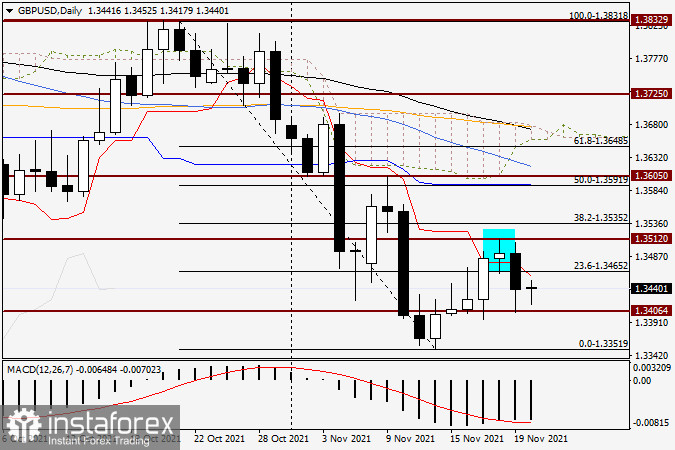
Daily
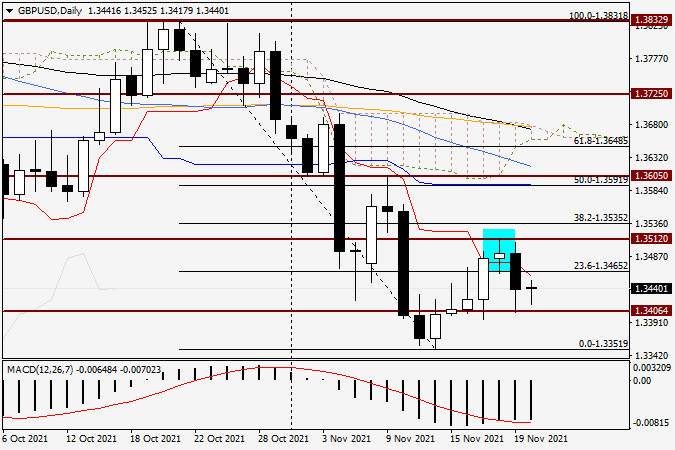
After the appearance of a candle of the Doji variety for November 18, which has approximately equidistant lower and upper shadows, it was quite possible to expect a decline in the exchange rate, which happened on the last day of last week's trading. At the same time, it should be noted that the highlighted candle appeared after an unsuccessful attempt to raise the rate above the important and significant psychological and technical level of 1.3500. In turn, the rebound that occurred from 1.3406 left a long lower shadow of the Friday candle, which signals strong support in this area. Based on the consideration of both timeframes, it can be assumed that a true breakdown of 1.3400 will send the pair to the support of 1.3350, where the minimum trading values were shown on November 12. If the bulls on the pound are able to rewrite the maximum trading values on November 18 at 1.3512 and gain a foothold above this mark, we can count on growth in the area of 1.3580-1.3620, where there is another strong resistance of sellers. In the meantime, I can offer purchases on declines to the nearest support zone of 1.3410-1.3400, and try selling after the pair rises to the resistance area of 1.3500-1.3512. In both cases, before opening positions, it is better to enlist the support of the corresponding candle signals on this or smaller time intervals, which will be considered in tomorrow's review.