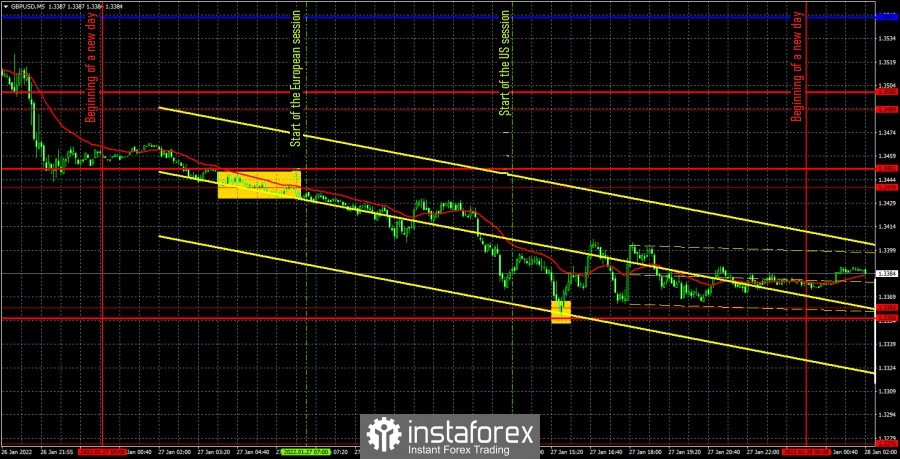
GBP/USD 5M

The GBP/USD pair repeated the path of the European currency on Wednesday evening and Thursday. The pound/dollar pair traded almost identically, which is not surprising, given what factors influenced the market mood. And only US factors influenced, namely the US central bank meeting and Fed Chairman Jerome Powell's speech. Thus, market participants bought the dollar, and did not sell the euro or the pound. This explains the similarity in the movements of both major currency pairs. We have already discussed the results of the meeting in our fundamental articles. It remains only to talk about the reports that were published in America on Thursday. As we have already said, the GDP report for the fourth quarter turned out to be significantly higher than forecasts and amounted to 6.9% q/q, compared with the value in the third quarter of 2.3% and the forecast of 5.3%. However, if you look closely at the pair's movement during the release of US statistics, it becomes clear that the dollar did not grow after GDP and other reports were published. On the contrary, it has adjusted by 50 points. However, this behavior of traders should not be misleading. If not for the strong GDP report, perhaps the upward correction would have been more powerful. Actually, this happens quite often when the price moves powerfully in one direction after the Fed meeting, but changes it a day later and fully restores to its original positions. Perhaps it was the GDP report that prevented the pair from quickly returning to the level of 1.3510. It should also be noted the report on orders for long-term goods, which showed a decrease of 0.9% mom, although forecasts predicted a drop of no more than 0.6% m/m. However, this report has had almost no effect on the pair. It remains only to deal with trading signals. The first and only sell signal was formed near the extreme level of 1.3439 literally 10 minutes before the opening of the European session. It should have been worked out. The price dropped to the extreme level of 1.3362 and rebounded from it at the beginning of the US session. Therefore, at this time it was necessary to take the profit on a short position. The profit was about 60 points. But it was not necessary to open longs (although they would have made a profit in the end), since the GDP report predicted a new fall of the pair, and not its growth.
We recommend to familiarize yourself with:
Overview of the EUR/USD pair. January 28. The Fed's path may turn out to be more "hawkish" than the Fed itself assumed. The collapse of the euro and the pound.
Overview of the GBP/USD pair. January 28. US dollar - pound sterling: the crushing victory of the first. US GDP grew stronger than expected.
Forecast and trading signals for EUR/USD on January 28. Detailed analysis of the movement of the pair and trading transactions.
GBP/USD 1H
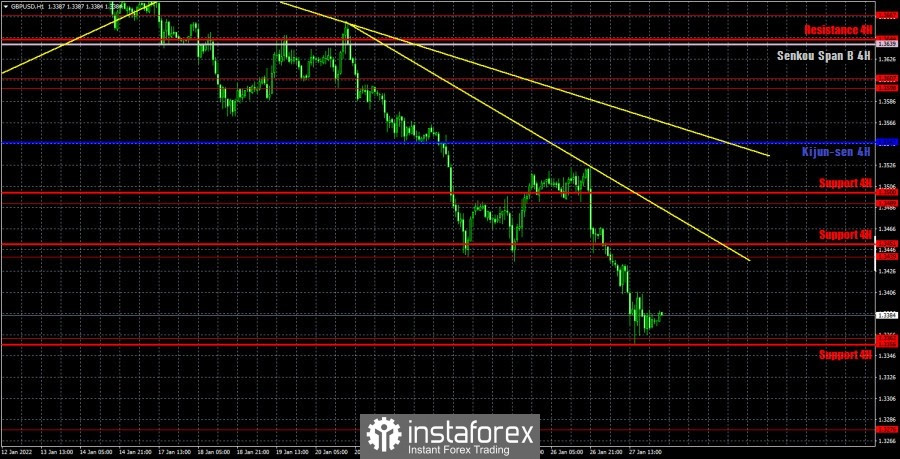
The pound/dollar pair as a whole maintains a downward trend on the hourly timeframe. As many as two new trend lines have been built, each of which supports the bearish traders. In general, we believe that the pound will continue to fall in the medium term. However, whatever it was, now there is still not a single signal that would indicate a possible growth of the pair. We highlight the following important levels on January 28: 1.3276, 1.3362, 1.3439, 1.3489. The Senkou Span B (1.3639) and Kijun-sen (1.3547) lines can also be signal sources. Signals can be "bounces" and "breakthroughs" of these levels and lines. It is recommended to set the Stop Loss level to breakeven when the price passes in the right direction by 20 points. The lines of the Ichimoku indicator can move during the day, which should be taken into account when determining trading signals. No important reports or other events are scheduled for Friday in the UK again. There will be several minor publications in America, but they are unlikely to provoke a reaction from traders. There can only be an index of consumer sentiment if its actual value will be very different from the forecast.
Explanations for the chart:
Support and Resistance Levels are the levels that serve as targets when buying or selling the pair. You can place Take Profit near these levels.
Kijun-sen and Senkou Span B lines are lines of the Ichimoku indicator transferred to the hourly timeframe from the 4-hour one.
Support and resistance areas are areas from which the price has repeatedly rebounded off.
Yellow lines are trend lines, trend channels and any other technical patterns.
Indicator 1 on the COT charts is the size of the net position of each category of traders.
Indicator 2 on the COT charts is the size of the net position for the non-commercial group.