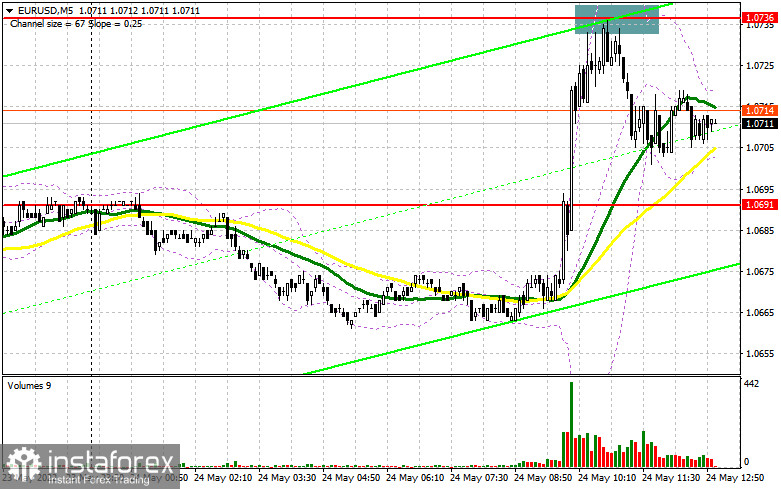
In my morning review, I mentioned the level of 1.0736 and recommended it as a good point to enter the market. Let's take a look at the 5-minute chart and see what happened there. After breaking through the immediate resistance at 1.0691, the price didn't retest it from top to bottom. So, I had to skip the strong upside movement of the euro. Surprisingly, the euro advanced right after the publication of the macroeconomic data which revealed a slowdown in European countries. A false breakout around 1.0736 was followed by a nice sell signal which resulted in a quick drop of the euro by 30 pips. This was a good result, given that we were selling against the trend. In the second half of the day, the technical picture remained almost the same.
For long positions on EUR/USD:
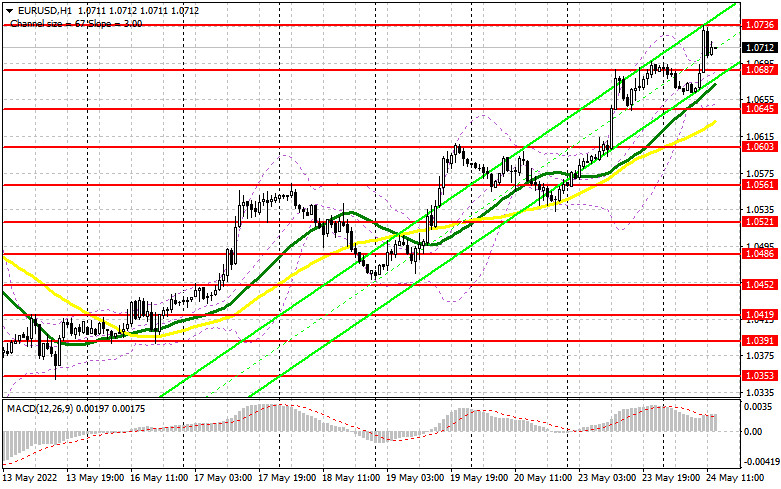
The intentions of the US and EU policymakers suggest that the monetary policies of these central banks will differ greatly by this autumn. This factor supports the euro as traders buy it on expectations that the ECB will raise the rate in the near future. Today, markets are watching the manufacturing and services PMI data in the US. The results will most likely come in below analysts' expectations, so bulls may attempt to break above the level of 1.0736. The best option would be to buy the pair around the new support area of 1.0687. This is where the price may fall if the US data exceeds the forecast and Fed Chairman Jerome Powell does not confirm the plan to pause the tightening cycle of the regulator. A false breakout of 1.0687 will generate a new signal to buy the euro within the current bullish scenario and with the prospect of going above the resistance of 1.0736. A breakout and a retest of this range will form a new signal for opening long positions with the possibility to test the high of 1.0775, where I recommend taking profit. A more distant target is found in the area of 1.0811. If EUR/USD declines at 1.0687, everything can change in just a second, especially given the fact that there are no real drivers to support the euro. Therefore, I advise you to wait with buying the pair. The best scenario would be a false breakout near the 1.0645 low. It is better to open long positions after a rebound only from the level of 1.0603, above which moving averages are located, or even lower at 1.0561. Keep in mind the possible upward correction of 30-35 pips within the day.
For short positions on EUR/USD:
If the pair continues to rise, a sell signal will be formed only after the formation of a false breakout at 1.0736, just as I described above. Short positions can be opened against the trend with the prospect of returning to the support area of 1.0687, a new level formed in the first half of the day. With strong US data and Powell's aggressive statements, this level will be of no interest to traders. Therefore, a breakout and consolidation below this range, as well as a retest from the bottom up, will generate a new sell signal and trigger the buyers' stops-loss orders. As a result, the pair may develop a strong downward movement to 1.0645, where I recommend taking profit. The area of 1.0603 will serve as a higher target although it could be reached only if bulls give up the fight. If EUR/USD moves higher in the afternoon, supported by low bearish activity at 1.0736 and weak US data, the uptrend will continue, thus validating the current bullish scenario. The best option in this case would be to open short positions on a false breakout in the area of 1.0775. You can sell EUR/USD immediately on a rebound from 1.0811, or even higher at 1.0844, considering a downward correction of 30-35 pips.
COT report
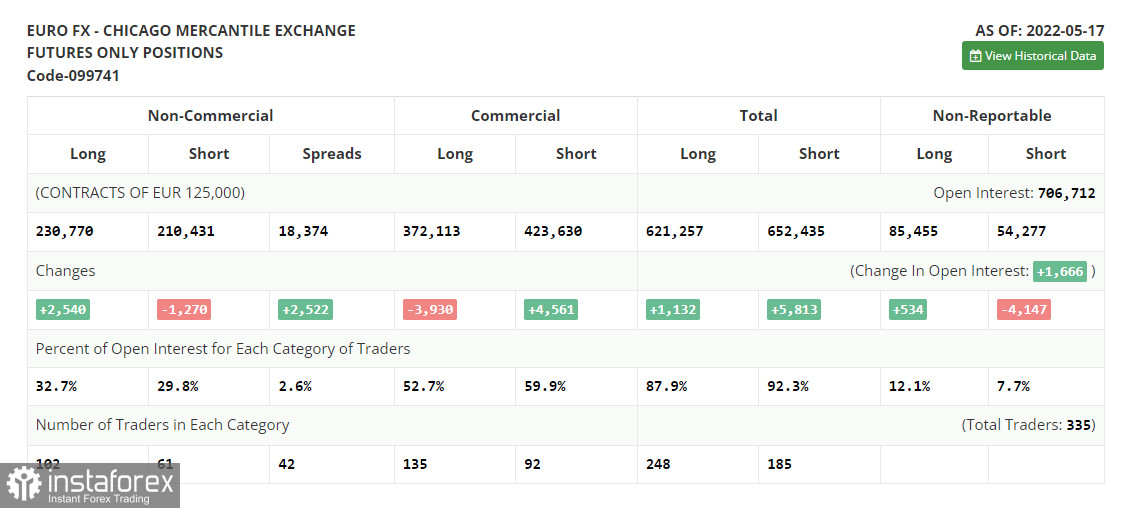
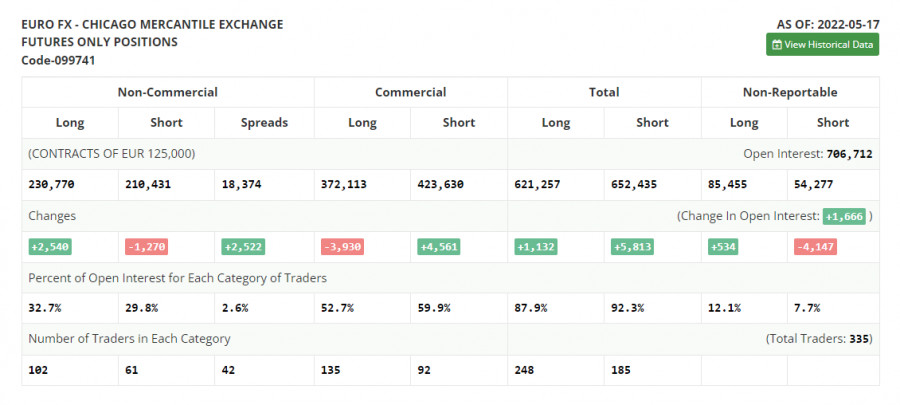
The COT report (Commitment of Traders) for May 17 recorded a further increase in long positions and a reduction in short ones. Traders continue to work at the lows, relying on new statements from the European Central Bank. The regulator has recently signaled that it was ready to raise interest rates in the near future. Officials of various European central banks repeatedly mentioned this possibility last week. The ECB Governing Council is now expected to raise the deposit rate by 25 basis points in July this year. The next increase will come in September and one more in December, which will bring the rate to 0.25% by the end of the year. Yet, some European policymakers are critical of this plan as they urge the regulator to take more aggressive steps to tackle record-high high inflation in the eurozone. The ECB is expected to raise the benchmark rate in September and December to 0.5% from its current zero level. The upside potential of the euro is also supported by speculations that the US Federal Reserve may slow down its monetary tightening in September after aggressive steps taken in spring and summer. The COT report shows that the number of long positions of the non-commercial group increased by 2,540, from 228,230 to 230,770, while short non-commercial positions decreased by 1,270, from 211,701 to 210,431. I have already mentioned before that the cheap euro is now more attractive to traders, and the change in the market balance in favor of bulls confirms this fact. By the end of the week, the total non-commercial net position increased and amounted to 20,339 against 16,529 a week earlier. The weekly closing price was also slightly higher and stood at 1.0556 against 1.0546.
Indicator signals:
Moving Averages
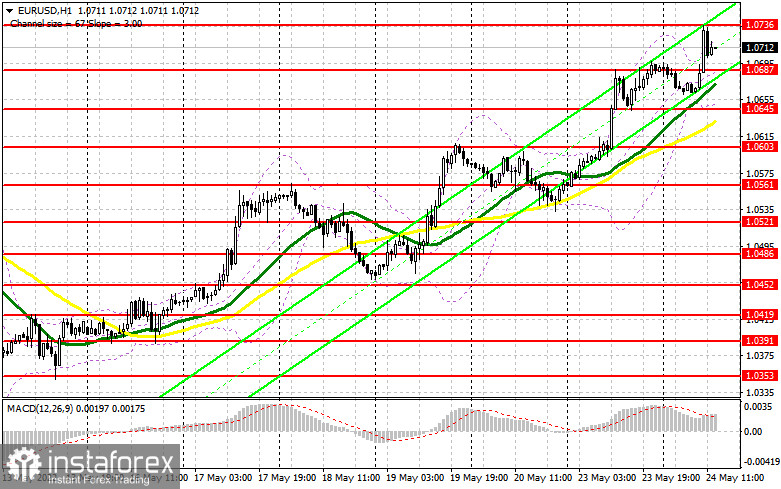
Trading above the 30 and 50-day moving averages indicates further growth of the euro.
Please note that the time period and levels of the moving averages are analyzed only for the H1 chart, which differs from the general definition of the classic daily moving averages on the D1 chart.
Bollinger Bands
In case of a decline, the lower band of the indicator around 1.0645 will act as support.
Description of indicators:
• A moving average determines the current trend by smoothing volatility and noise. 50-day period; marked in yellow on the chart;• A moving average determines the current trend by smoothing volatility and noise. 30-day period; marked in green on the chart;• MACD Indicator (Moving Average Convergence/Divergence) Fast EMA, 12-day period; Slow EMA, 26-day period. SMA with a 9-day period;• Bollinger Bands: 20-day period;• Non-commercial traders are speculators such as individual traders, hedge funds, and large institutions who use the futures market for speculative purposes and meet certain requirements;• Long non-commercial positions represent the total number of long positions opened by non-commercial traders;• Short non-commercial positions represent the total number of short positions opened by non-commercial traders;• The total non-commercial net position is the difference between short and long positions of non-commercial traders.