When to go long on GBP/USD:
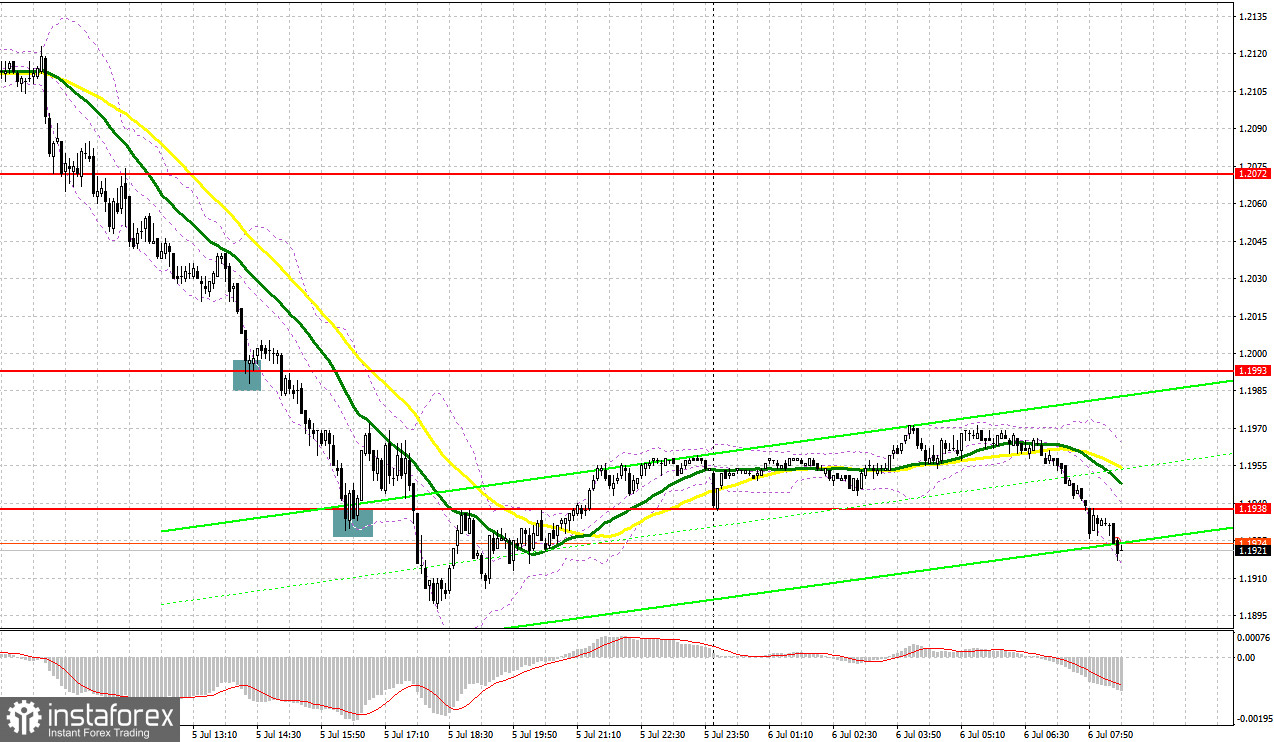
Several market entry signals were formed yesterday. Let's take a look at the 5-minute chart and see what happened. I paid attention to the 1.2094 level in my morning forecast and advised making decisions from it. A breakthrough of this range even amid quite adequate statistics on activity in the UK, indicates the pessimism that has filled the markets recently due to fears associated with an impending recession. Unfortunately, I did not wait for the reverse test of 1.2094 from the bottom up, just a few points were not enough, so I did not manage to enter short positions. In the afternoon, a false breakout at 1.1993 seemed to give ghostly chances for a correction, which, alas, did not take place. Only long positions on a false breakout from 1.1938 made it possible to compensate for losses and earn some money - the upward movement amounted to more than 30 points.
COT report:
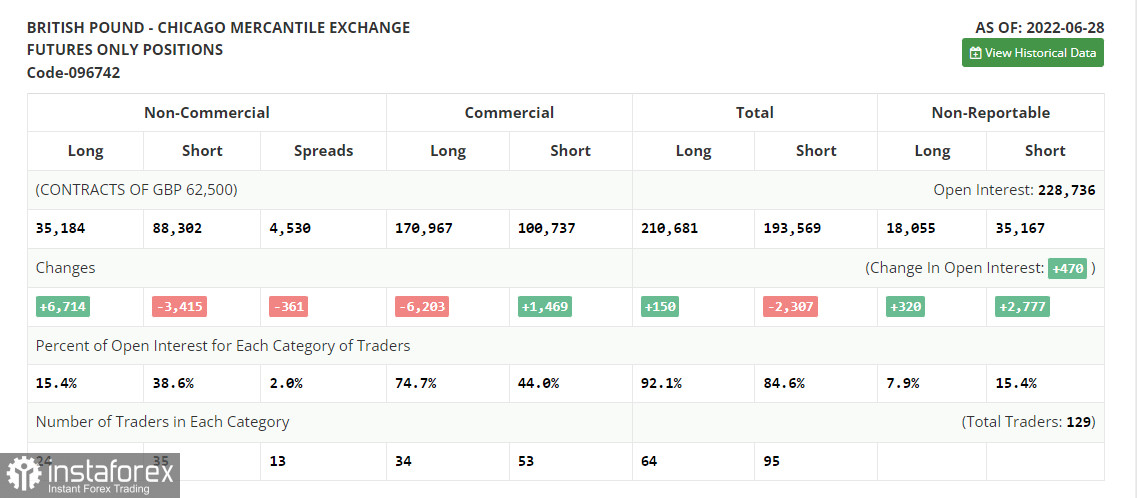
Before analyzing the technical picture of the pound, let's look at what happened in the futures market. The Commitment of Traders (COT) report for June 28 logged a decline in short positions and a sharp increase in long positions, which indicates an attempt to buy another annual low after the Bank of England's decision to raise interest rates and remain committed to an aggressive monetary policy. The sharp inflationary surge in May of this year does not leave the central bank a chance for a softer tightening cycle. The ongoing cost of living crisis in the UK is making the economy more vulnerable, especially as rates are forced to rise to fight high inflationary pressures. All this does not add to the pound's appeal, which is steadily moving down to the lows of 2020. The policy of the Federal Reserve and its pace of interest rate hikes is giving the dollar much more support. The COT report indicated that long non-commercial positions rose 6,714 to 35,184, while short non-commercial positions decreased 3,415 to 88,302, however this did not greatly affect the overall picture of the bear market, and led only to a small decrease in the negative value of the non-commercial net position from the level of -63,247 to the level of -53,118. The weekly closing price decreased and amounted to 1.2201 against 1.2295.
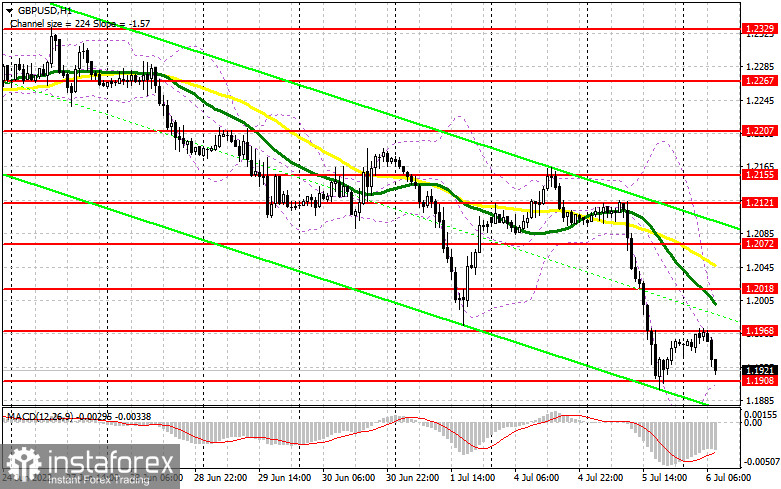
Today, among the UK data, only the report on the index of business activity in the UK construction sector for June this year can be distinguished. However, as practice shows, even good numbers do not provide the necessary support for the pound. Yesterday's PMI reports are proof of this. In technical terms, you can count on the emerging divergence on the MACD indicator, which is perfectly visible on the hourly chart. Monetary Policy Committee member John Cunliffe's speech is unlikely to significantly change the pound, so only a false breakout in the immediate support area of 1.1908 will provide a buy signal that can stop this bearish madness that we are now seeing. The primary target in this case will be the nearest resistance at 1.1968. Consolidation above this range and a reverse downward test will provide a signal to buy while aiming for a larger recovery to the 1.2018 area, where the moving averages play on the bears' side. Bulls will obviously take a break in that area. A more distant target will be the area of 1.2072, where I recommend taking profits.
In case the pound falls during the European session and the lack of activity at 1.1908, I advise you to postpone long positions until the next support at 1.1859. Forming a false breakout there, by analogy with what I analyzed above, will provide an entry point into long positions, counting on at least some upward correction. You can buy GBP/USD immediately on a rebound from 1.1816, or even lower - in the area of 1.1742, counting on correcting 30-35 points within the day.
When to go short on GBP/USD:
The bears have achieved another renewal of the annual low and now their main task will be to protect the nearest resistance at 1.1968, the test of which can take place already in the morning. However, this is clearly not enough to continue the downward trend. Of course, the best option for opening short positions would be a false breakout forming at 1.1968, which was formed on the basis of today's results. This will provide an entry point for the pair to fall and break through support at 1.1908, which is quite an important level. A real struggle will unfold for it, as the bulls will try to build the lower border of a new upward corrective channel there. Only a breakthrough and a reverse test from the bottom up of this level will bring the GBP/USD down to a low of 1.1859, leaving a good opportunity to update support at 1.1816. A more distant target will be the area of 1.1742, where I recommend taking profits.
If the pair rises during the European session and there are no bears at 1.1968, the bears may loosen their grip. In this case, I advise you to postpone short positions until 1.2018. I advise you to sell the pound there only after a false breakout. You can open short positions immediately for a rebound from the high of 1.2072, or even higher - from 1.2121, based on the correction of the pair down by 30-35 points within the day.
I recommend to read:
Indicator signals:
Moving averages
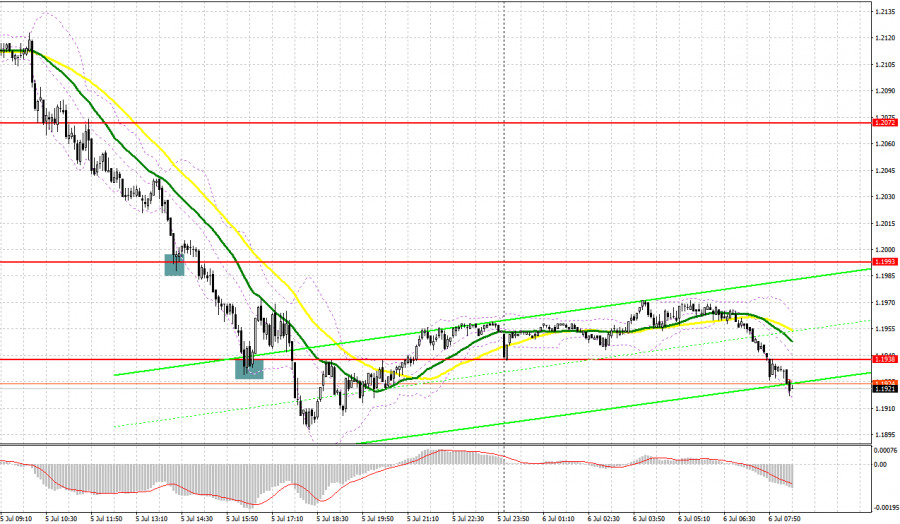
Trading is below 30 and 50 moving averages, which indicates a continuation of the pound's decline.
Note: The period and prices of moving averages are considered by the author on the H1 hourly chart and differs from the general definition of the classic daily moving averages on the daily D1 chart.
Bollinger Bands
A breakthrough of the lower border of the indicator in the area of 1.1908 will increase pressure on the pair. If the pair grows, the upper border of the indicator around 1.1950 will act as resistance.
Description of indicators
- Moving average (moving average, determines the current trend by smoothing out volatility and noise). Period 50. It is marked in yellow on the chart.
- Moving average (moving average, determines the current trend by smoothing out volatility and noise). Period 30. It is marked in green on the chart.
- MACD indicator (Moving Average Convergence/Divergence — convergence/divergence of moving averages) Quick EMA period 12. Slow EMA period to 26. SMA period 9
- Bollinger Bands (Bollinger Bands). Period 20
- Non-commercial speculative traders, such as individual traders, hedge funds, and large institutions that use the futures market for speculative purposes and meet certain requirements.
- Long non-commercial positions represent the total long open position of non-commercial traders.
- Short non-commercial positions represent the total short open position of non-commercial traders.
- Total non-commercial net position is the difference between short and long positions of non-commercial traders.