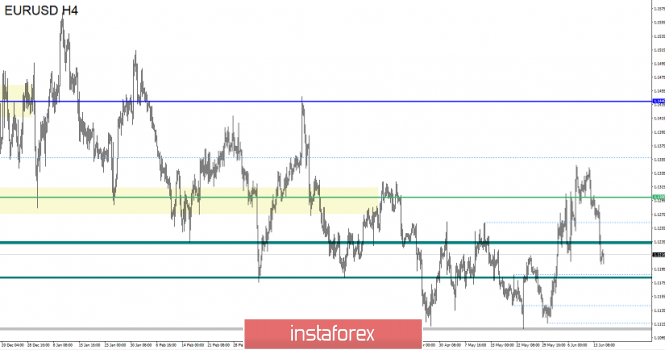
By the end of the last trading week, the euro / dollar currency pair showed a high volatility of 85 points. As a result, a real attempt was made to restore the original trend. From the point of view of technical analysis, we see that the main finding trend is still alive, and the theory of a possible reversal of the trend was not successful. The current restoration candles are proof to us. Considering the trading chart in general terms, we see a 65% recovery in quotes, with respect to early growth, whether this movement has the clock frequency of "Momentum". In global terms, yes, this is the case for the reasoning. For the best understanding of the whole picture I advise you to open the daily EURUSD chart.
We turn to the information and news background, where we have statistics from the United States, which were not so bad. Retail sales showed an increase from 0.3% to 0.5%, but they expected even better results of 0.7%. The rate of the American currency spurred statistics on industrial production, where they recorded an increase from 0.9% to 2.0%. Against the general background of the overbought euro, there was an excellent way to recover the dollar. Going further, and according to tradition, we will touch upon the subject of Brexit, where the head of the British Foreign Ministry, Jeremy Hunt, said: "In the EU, say that if they turn to the British Prime Minister, who will have ideas about how to resolve the issue of the border in Northern Ireland, they will be ready to revise the package of agreements." Everything, of course, is excellent, but Jeremy Hunt, though he is a candidate for the post of prime minister of Britain, but a clear favorite Boris Johnson, and his views on the agreement and the deal with the EU are completely different.
What's left behind the scenes?
Last weekend, the news broke that India responded to the US trade attacks and raised duties on 28 items of goods. These are almonds, apples, walnuts and other items. According to experts, this decision will cost the US companies $ 200-300 million. The very step that India did not back down and is ready to take retaliatory steps clearly scares large investors in the United States, as the picture of the World Trade War may lose with new colors.
Today, in terms of the economic calendar, we do not have any consistent statistics for Europe and the United States. The only thing that can be so is the comprehension of new duties and the intrigue of a possible answer.
Further development
Analyzing the current trading schedule, we see that after the Friday rally, the quotation went down to the level of 1.1202, where it felt under a periodic footing and slowed down the quotation in the form of rollback-stagnation against the background of a sharp overheating. Now, from the point of view of logic, it would be worth waiting for a temporary bump around current values, where you can clearly listen to the information flow regarding the steps of India and whether there will be a weakening of the American currency against this background.
Based on the available information, it is possible to decompose a number of variations, let's consider them:
- Purchase items are considered higher than 1.1235.
- The positions for sale were initially considered from the value of 1.1260, that is, now there are already fixation points. Further positions will be considered in the event of the resumption of the inertial course and price fixing lower than 1.1190.
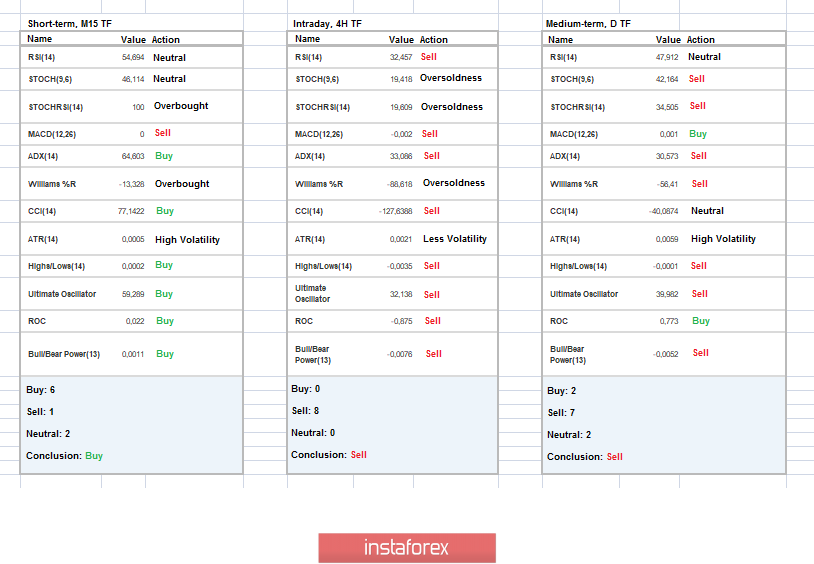
Indicator Analysis
Analyzing a different sector of timeframes (TF), we see that indicators in the short-term appeared an upward interest against the background of stagnation and a pullback. On the other hand, intraday and medium term are prone to downward interest against the background of the general course.
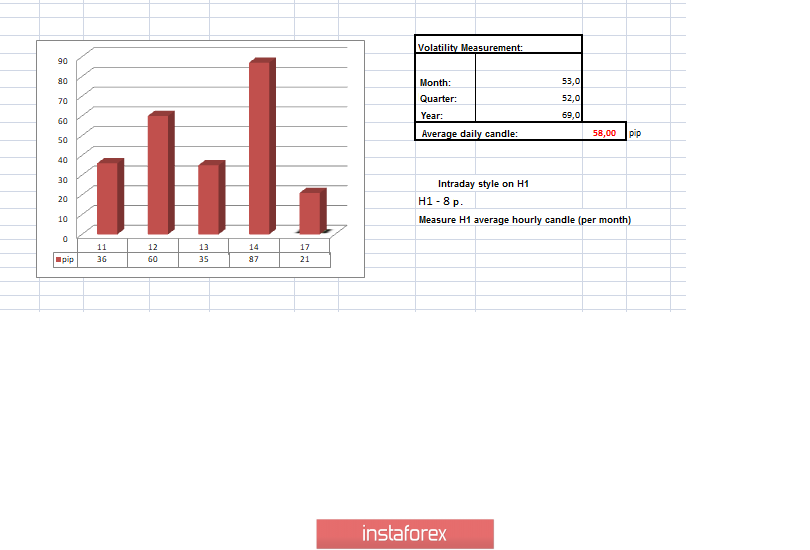
Weekly volatility / Measurement of volatility: Month; Quarter; Year
Measurement of volatility reflects the average daily fluctuation, based on monthly / quarterly / year.
(June 17 was based on the time of publication of the article)
The current time volatility is 21 points. It is likely to assume that in the event of a market reaction to the information background, or the inertial move, the volatility can continue to grow. Unless, of course, stagnation occurs in one place.
Key levels
Zones of resistance: 1.1300 **; 1.1440; 1.1550; 1.1650 *; 1.1720 **; 1.1850 **; 1.2100.
Support areas: 1.1180; 1.1112; 1.1080 *; 1.1000 ***; 1.0850 **.
* Periodic level
** Range Level
*** Psychological level