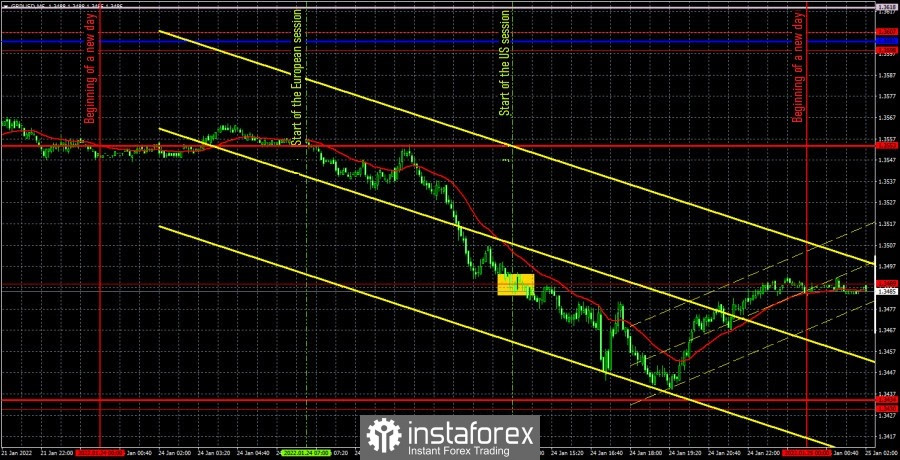
GBP/USD 5M

The GBP/USD pair fell on Monday, as if it had been cut down. The pound fell by 130 points during the day, although there were no obvious reasons for this. Yes, business activity indices in the service and manufacturing sectors were published in Britain this morning, but they turned out to be only slightly worse than forecasts and clearly could not provoke a 130-point decline in the pair. Traders reacted to the indices of business activity in the United States by selling off the dollar, thanks to which the pair's exchange rate increased by 35 points, but in the next two hours it fell by exactly the same amount. Therefore, weak statistics from overseas did not bring any effect. So why did the pound fall? From our point of view, this is happening for technical reasons. We have already analyzed more than once that the pound rose quite unreasonably at the end of 2021 - the beginning of 2022. Now we can assume that it is "repaying debts". Moreover, the downward trend of 2021 continues, and the fundamental background remains on the side of the US currency. At the same time, it is even getting stronger, since there is nothing in the UK that could support the pound. But in the United States, everyone is already talking about 6 or 7 increases in the key rate. In addition, the tension of the geopolitical situation in Eastern Europe contributes to getting rid of risky assets and the accumulation of low-risk ones, which is the US dollar. But the pound is just in the "risky" category, so its fall can also be explained by this factor. Only one trading signal was generated during Monday. It is a pity that so little, as the movement was strong and trending, which is always good for traders. Nevertheless, at the very beginning of the day, the price was not near important levels and lines, so the first sell signal was formed only at the beginning of the US session, when the price overcame the extreme level of 1.3489. After that, the downward movement was about 40 points, and it was possible to manually close the short position in the late afternoon, as we always recommend.
We recommend to familiarize yourself with:
Overview of the EUR/USD pair. January 25. Geopolitics, the Fed, global market crashes.
Overview of the GBP/USD pair. January 25. The British pound is falling due to geopolitics and the possibility of more Fed rate hikes in 2022.
Forecast and trading signals for GBP/USD on January 25. Detailed analysis of the movement of the pair and trading transactions.
GBP/USD 1H
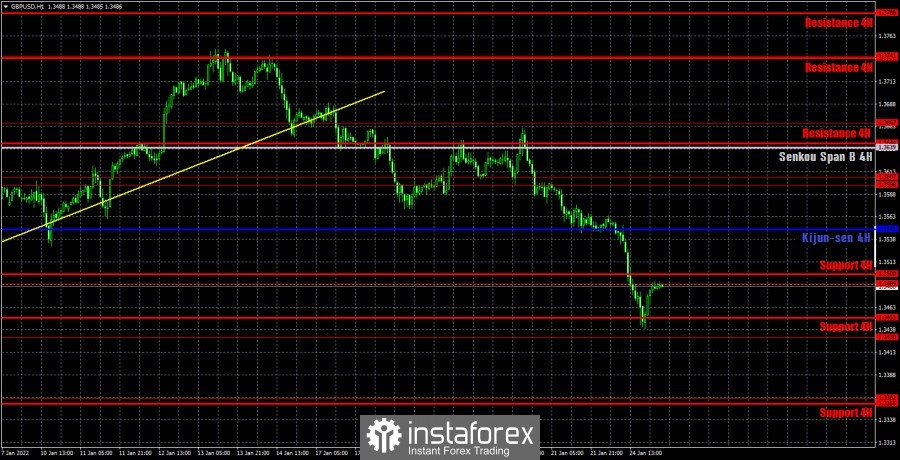
The pound/dollar pair continues a strong downward movement on the hourly timeframe. The pound is now in a high-risk zone, so its fall does not surprise us. Even without the brewing conflict in Eastern Europe, we still counted on a new fall of the pair. All the important lines of the Ichimoku indicator have been overcome, so the way down is open. We believe that the ultimate goal of another fall in the British currency is around the level of 1.3100. And maybe even lower. On January 25, we highlight the following important levels: 1.3276, 1.3362, 1.3430, 1.3489, 1.3598-1.3607. The Senkou Span B (1.3639) and Kijun-sen (1.3549) lines can also be signal sources. Signals can be "bounces" and "breakthroughs" of these levels and lines. It is recommended to set the Stop Loss level to breakeven when the price passes in the right direction by 20 points. The lines of the Ichimoku indicator can move during the day, which should be taken into account when determining trading signals. There are no important publications and events scheduled for Tuesday in the UK. In the United States, as we have already said, there is only an index of consumer confidence, which has very little chance of provoking a market reaction.
Explanations for the chart:
Support and Resistance Levels are the levels that serve as targets when buying or selling the pair. You can place Take Profit near these levels.
Kijun-sen and Senkou Span B lines are lines of the Ichimoku indicator transferred to the hourly timeframe from the 4-hour one.
Support and resistance areas are areas from which the price has repeatedly rebounded off.
Yellow lines are trend lines, trend channels and any other technical patterns.
Indicator 1 on the COT charts is the size of the net position of each category of traders.
Indicator 2 on the COT charts is the size of the net position for the non-commercial group.