Hello, traders!
In today's article on the North American dollar pair, we will outline the main macroeconomic events that will be presented to market participants before the end of this week, after which we will proceed to technical analysis and search for optimal trading solutions for the USD/CAD pair.
So, first on the expected statistics.
USA: new home sales, durable goods orders, GDP, personal income and expenses, and the basic price index of personal consumption expenditures.
Canada: balance of payments, producer price index, and GDP.
Now let's consider the technical picture for the USD/CAD pair. Despite the fact that today is already Wednesday (mid-week), it makes sense to look at the weekly chart and note the most important nuances.
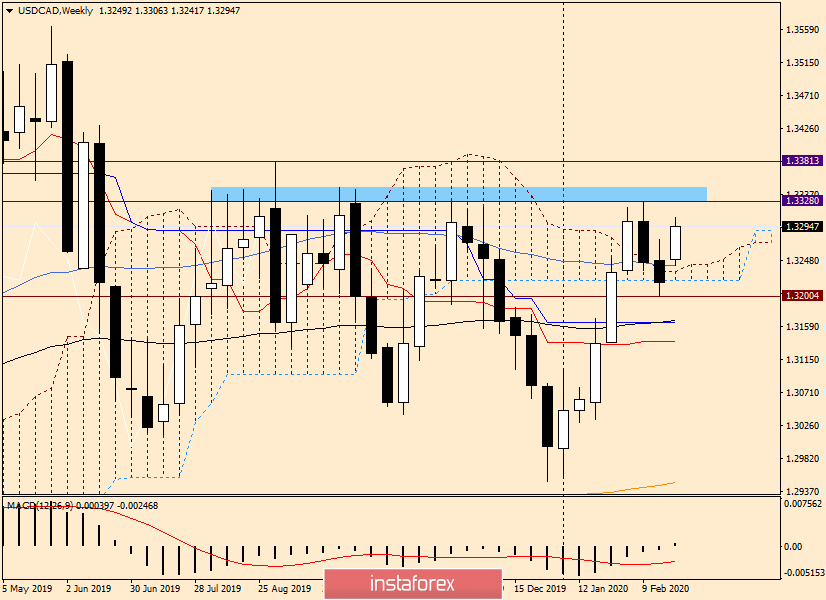
Weekly
The "Canadian" in the company of the Swiss franc and the single European currency strengthened against the US dollar at last week's auction. The USD/CAD pair ended the session on February 17-21 under the lower border of the Ichimoku indicator cloud. It would seem that this may be a signal to continue the downward dynamics of the pair. However, at the time of writing this article, everything is exactly the opposite. The pair is growing and is likely to test the resistance of sellers for a breakdown of 1.3328, where the maximum values were shown at the auction the week before last.
The lows of the previous trades of 1.3200 are significant support, the breakdown of which will return the market to the power of sellers. The pair found good support at 1.3242 during the current five-day trading session. By the way, there is also a 50-simple moving average, which also contributed to the movement of the quote in the north direction.
It is necessary to pay attention to the difficulties experienced by the bulls on the instrument in the price area of 1.3328-1.3381. The pair have repeatedly fallen down from the indicated range, so in my opinion, it will be possible to talk about the prospects of an upward scenario only after the breakdown of the sellers' resistance at 1.3381 and consolidation above this level.
The bears will regain their power over the pair only if the support of 1.3200 breaks down and is anchored under this strong and important technical level.
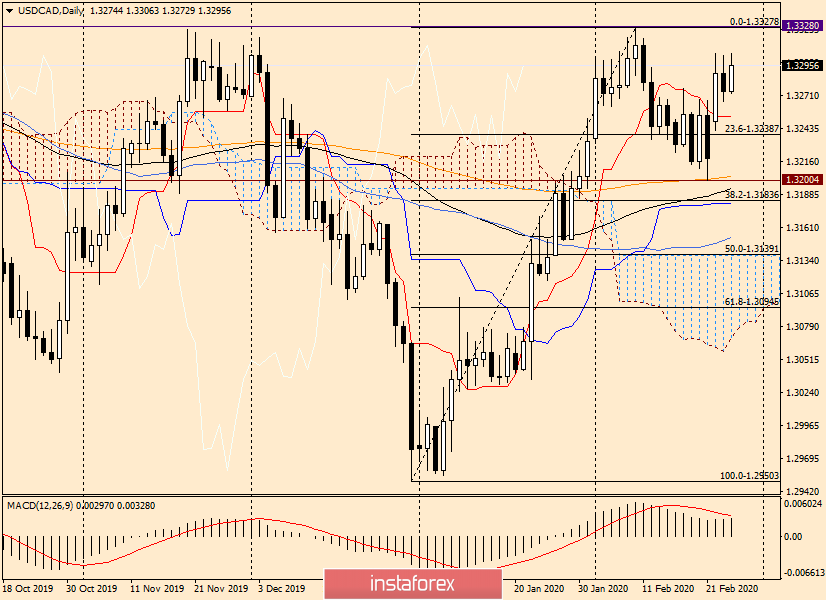
Daily
In the daily timeframe, we see that along with the mark of 1.3200, the price was well supported by the 200-exponential moving average, which started the rate rise. The Tenkan line of the Ichimoku indicator has already been passed, and it seems that the pair has fixed higher.
Now all attention should be focused on the resistance near 1.3381. If a bearish or Japanese candlestick pattern appears in the area, this will be a good signal to open short positions on USD/CAD.
In the case of a breakdown of the resistance of 1.3328 and fixing above this mark, you can try careful purchases on the rollback to it, since a whole cascade of resistances passes above, the main of which is 1.3381.
Can I try buying after a likely decline to the Tenkan line? I think so, but before that, you need to look carefully at the candles, after which the downward movement began. If we see a strong reversal signal, purchases will pose an increased risk.
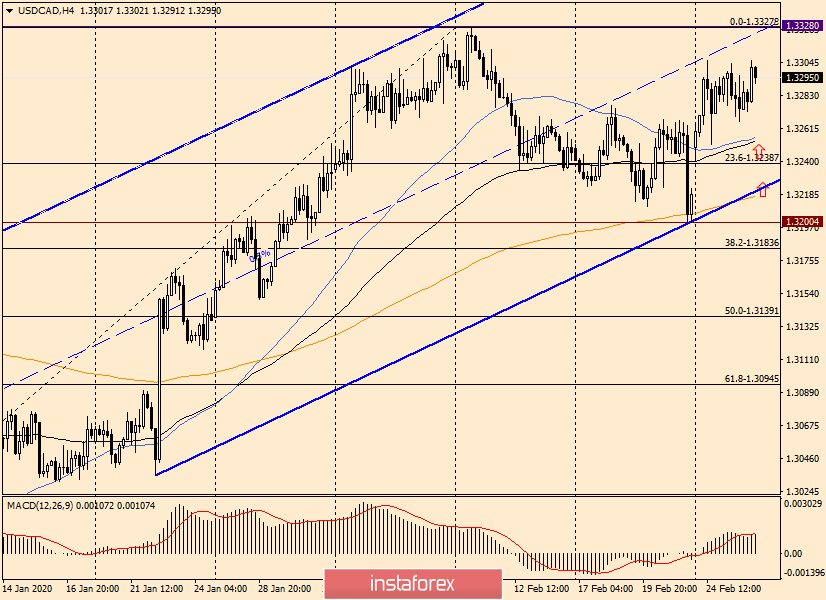
H4
The technical picture on this chart is more in favor of buying since the pair is trading in the ascending channel and above the moving averages used. Judging by H4, I can suggest the following plan.
We consider purchases after the decline in the areas of 1.3260 and 1.3220. As you can see, there are moving averages of 50 MA, 89 EMA, and 200 EMA at 1.3217. We do not discount the level of 23.6 Fibo from the rise of 1.2950-1.3328, as well as the support line of the ascending channel.
As I have repeatedly noted, the average channel lines tend to provide strong support or resistance to the price. In this case, the middle line crosses the resistance level of 1.3328. If candlestick signals for a decrease appear below this mark, you should try selling the pair. In my personal opinion, the most likely scenario at the moment looks upward.
Good luck!