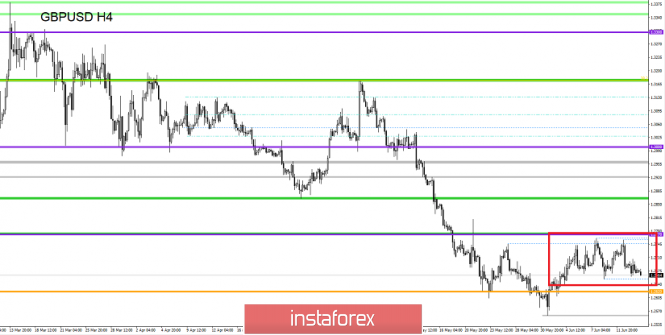
For the last trading day, the currency pair pound / dollar showed an extremely low volatility of 45 points. As a result, the quotation continued to fluctuate within the lower limit of the outset. From the point of view of technical analysis, we see that the side channel 1.2660 / 1.2750 continues its formation, developing at the current time near the lower border and drawing a clear stagnation. Looking at the chart in general terms, we see that the correctional movement of 1.2558 ---> 1.2761 led us to a stagnation in the form of a flat, which probably serves as a certain regrouping of trading forces, which is a good sign.
The information and news background of the past day had practically no statistical data in it. The only thing that could be identified was the unemployment benefit in the United States, where the characteristic increase was from 1.693K to 1.695K with a forecast of 1.680K. As you already understand, the news, in principle, did not play. The information background was more interesting. From Britain, there was news that Boris Johnson won the first round of the election of the leader of the Conception Party. In the first round of the tour of the participation of the joint venture of the Communities of the Communist Party of the Communist Party, the ex-ministerial of foreign affairs received 114 votes. The second round is in June 18, but, in principle, everything is already understood. By the way, one of the reasons for the current flat is the uncertainty associated with the elections, or rather, with the further fate of the UK & EU divorce process.
Today, in terms of the economic calendar, we have data on retail sales in the United States, where growth is expected from 3.1% to 3.4%. At the same time, data on industrial production will be published in the States, where growth is also expected, from 0.9% to 2.5%.
The upcoming trading week in terms of the economic calendar is quite rich in comparison with the past. We have two meetings at once - the Fed and the Bank of England are also a pretty good layer of statistical data. The most interesting events are displayed below --->
Tuesday, June 18
United States 12:30 UTC+00 - Number of building permits issued (May): Prev. 1.290M ---> Forecast 1,300M
United States 12:30 UTC +00 - The volume of construction of new homes (May): Prev. 1,235M ---> Forecast of 1,240M
Wednesday, June 19
United Kingdom 8:30 Universal time. - Consumer Price Index (CPI) (y / y) (May): Prev. 2.1% ---> Forecast 2.2%
18:30 Universal time - Fed meeting followed by FOMC press conference
Thursday, June 20
United Kingdom 8:30 Universal time. - Retail Sales (YoY) (May): Prev. 5.2% ---> Forecast 4.6%
11:00 UTC+00 - Bank of England meeting
Friday, June 21
United Kingdom 8:30 Universal time. - Public sector borrowing (May): Prev. 4.97V ---> 5.10V Forecast
United States 14:00 UTC+00 - Sales in the secondary housing market (May): Prev. 5.19M ---> Forecast 5.24M
These are preliminary and subject to change.
Further development
Analyzing the current trading chart, we see that the cutting quotation slowed down within the lower boundary of the side channel 1.2660 / 1.2750. It is likely to assume that the fluctuation within the limits of the existing framework will continue, where traders carefully analyze the boundaries for breakdown, as the current movement reflects a certain accumulation that will lead to new turns of momentum.
Based on the available information, it is possible to decompose a number of variations, let's consider them:
- Positions for purchase is considered in case of price fixing higher than 1.2700.
- If we still do not have positions for sale, we consider them in case of price fixing lower than 1.2650.
Indicator Analysis
Analyzing a different sector of timeframes (TF), we see that indicators in the short term have a variable upward interest against the background of stagnation. On the other hand, intraday and medium term retain a downward interest.
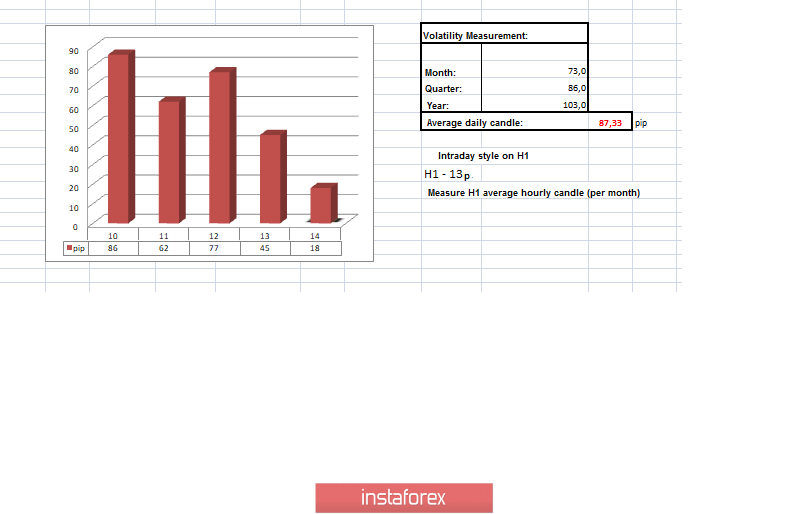
Weekly volatility / Measurement of volatility: Month; Quarter; Year
Measurement of volatility reflects the average daily fluctuation, based on monthly / quarterly / year.
(June 14 was based on the time of publication of the article)
The current time volatility is 18 points, which is a low value for a given time segment. It is likely to assume that the current stagnation will lead to acceleration, but if we keep the oscillation within the boundaries of the flat, then we should not expect anything cardinal.
Key levels
Zones of resistance: 1.2770 **; 1.2880 (1.2865-1.2880) *; 1.2920 * 1.3000 **; 1.3180 *; 1,3300 **; 1.3440; 1.3580 *; 1.3700.
Support areas: 1.2620; 1,2500 *; 1.2350 **.
* Periodic level
** Range Level