Hello, colleagues!
Today's review of the main currency pair has to start again with the coronavirus. The assumptions of some experts that the peak of the coronavirus has passed were not justified. In China, the situation has stabilized, however, the threat and spread of COVID-19 in other parts of the world seems to be gaining momentum. The epidemic is spreading, the number of cases and deaths is increasing every day. In such conditions, the wave of panic seriously affects the tourist business, as well as various areas of production.
Against this background, the probability of another global economic crisis is already being seriously considered.
Global financial markets are panicking and collapsing. Stock indices have lost about 3% over the past two days. It's only the beginning. All this is very disturbing and sad, but it's time to return to the topic of today's review.
If you look at the economic calendar, you can see that yesterday's data from the US housing price index from S&P was better than expected. However, consumer confidence did not meet the forecasts of experts and was below the expected values.
Today, you should pay attention to the speech of the President of the European Central Bank (ECB), Christine Lagarde, which is scheduled at 14:00 (London time). New building sales data will be received from the United States at 16:00 (London time). Neil Kashkari, a member of the Open Market Committee, will speak at 19:00 (London time). This is probably all, and we can proceed to the consideration of price charts.
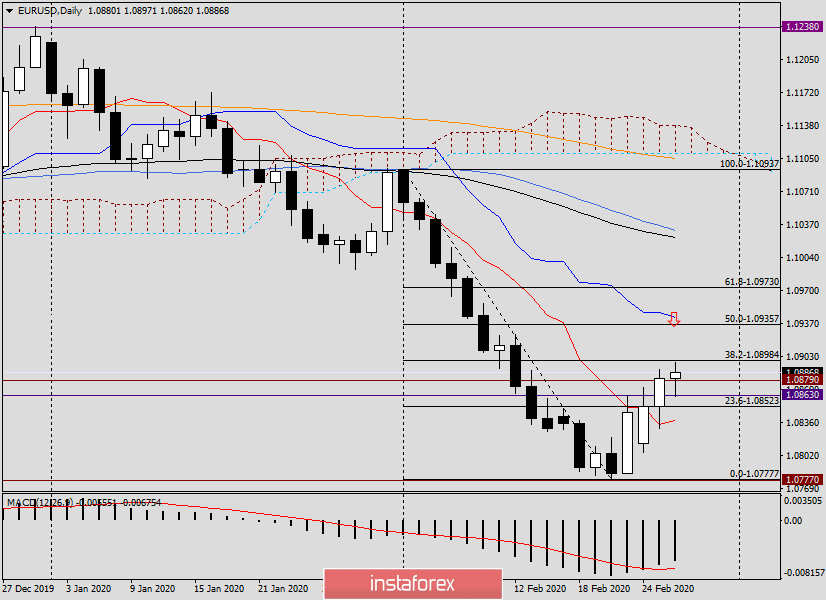
Daily
As expected in yesterday's EUR/USD review, the first priority for players to increase will be the closing of trading on February 25 above the broken support level of 1.0879. The euro bulls managed to do this. Although, look at how hard it is! Tuesday's trading ended at 1.0880, which is just 1 point above the broken level. Nevertheless, it actually closed higher. Now the main question is - what's next?
At the time of writing, the pair was already falling to 1.0862. Now it is recovering and trading near 1.0879, leaving only a shadow at the bottom. I believe that in the absence of important events in the economic calendar, trading on the euro/dollar pair will be determined by technical factors. If so, the pair has every chance to continue climbing to the Kijun line of the Ichimoku indicator, which is located at 1.0943. However, in the previous article on the main currency pair, the next target was the area of 1.0900-1.0920 and it remains relevant. In addition, it is unclear what Christine Lagarde will say and what will be the tone of the ECB head's speech. However, according to the current picture on the daily chart, there is every reason to expect the EUR/USD to continue to rise.
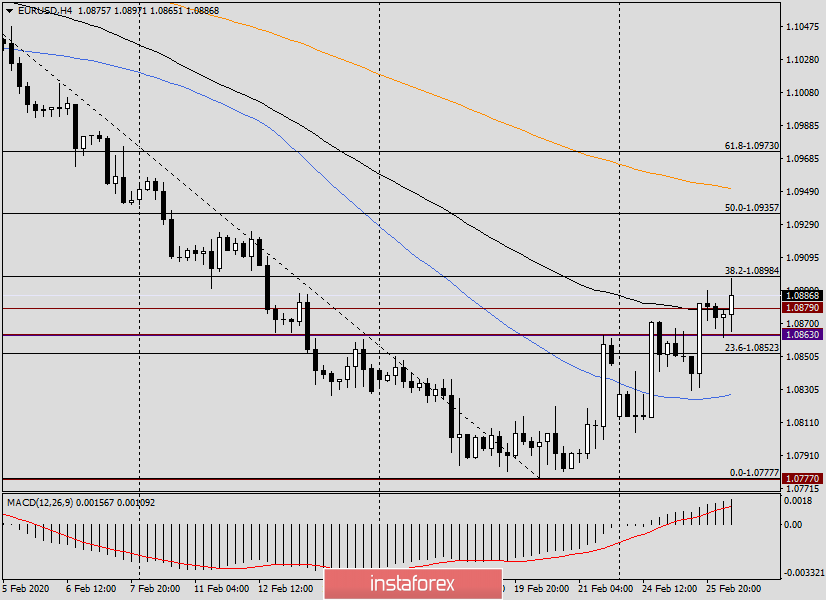
H4
But on the four-hour chart, the picture is not so rosy for those who expect a rise in the euro/dollar. As it was supposed yesterday, the 89-exponential moving average provides serious resistance to growth attempts and cannot be passed up yet. In this regard, several candles appeared, the form and essence of which can be interpreted as preparation for a possible decline.
I believe that all the points will be placed by the current candle, which is just bursting up and can form quite impressive. In the case of a breakdown of the 89 EMA and fixing above, we wait for a rollback to the broken exponent and buy. If it is not possible to break through 89 EMA now and the pair will fall to the 50-simple moving average, which is at 1.0827, it is worth looking at purchases. An additional signal will be the appearance of a bullish candle near 1.0830, signaling a likely upward reversal.
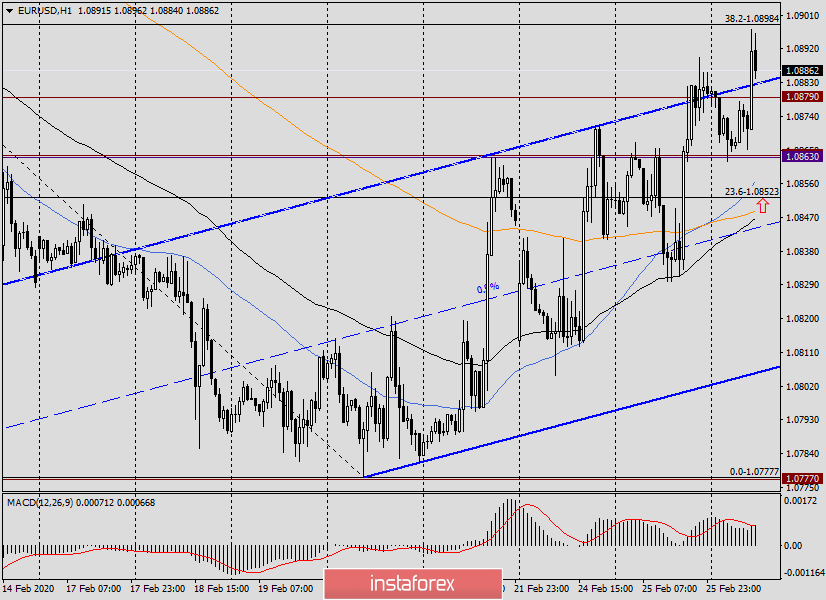
H1
The hourly chart has its own problems. The pair can not break through and gain a foothold above the resistance line of the ascending channel. At the end of the review, there is another attempt to do this, and it may succeed.
If this does not happen and the pair falls to the moving averages, where the arrows are displayed, you can try buying. This is the price zone of 1.0855-1.0845. The nearest targets is in the area of 1.0900-1.0920 and higher targets for fixing the expected profit from purchases is the price area of 1.0945-1.0965.
There are fewer options for sales. If a bearish candle or candlesticks appear on the way to 1.0965, you can try selling with the targets in the area of 1.0920-1.0880.
Good luck!