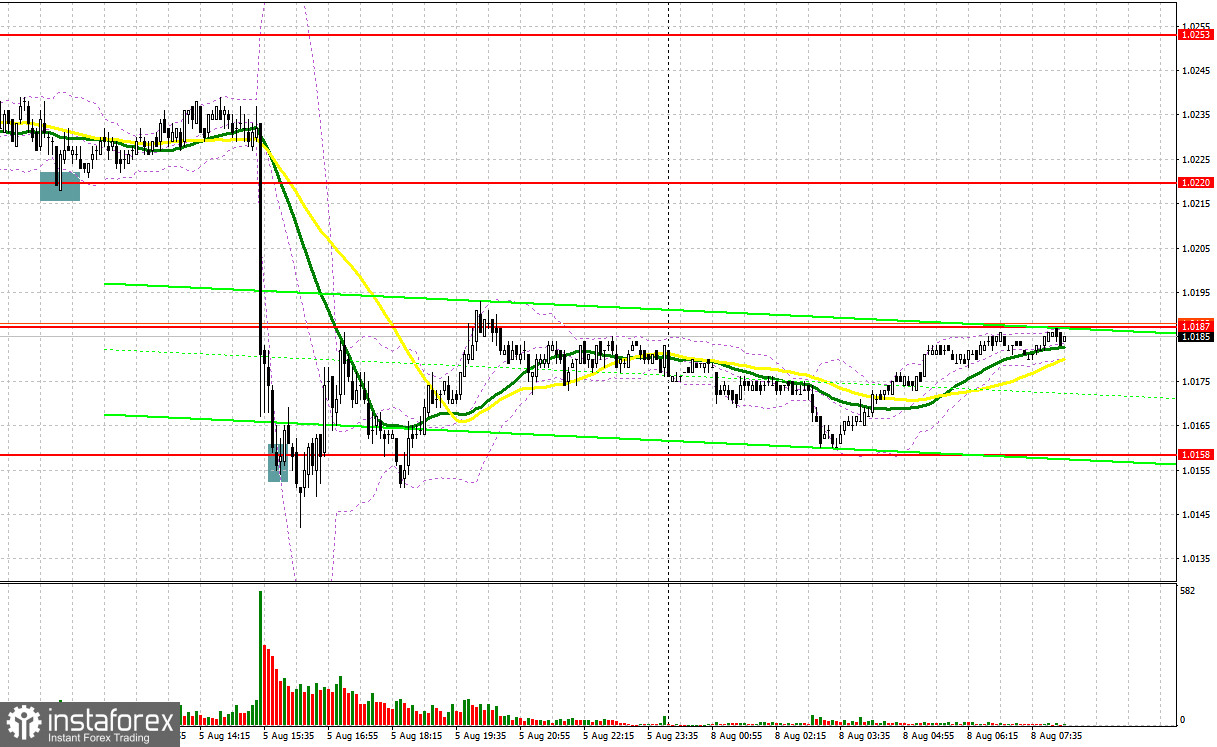
Several market entry signals were formed on Friday. Let's take a look at the 5-minute chart and see what happened. I paid attention to the 1.0220 level in my morning forecast and advised making decisions on entering the market from it. As a result of the euro's movement down to the area of 1.0220 in the morning, a false breakout was formed, which led to an excellent buy signal. Even before the release of data on the US market there, the pair recovered by 20 points, but the figures released for July sharply returned demand for the US dollar, as the actual value of the unemployment rate exceeded economists' forecasts. After the pair's decline, bulls tried to find the bottom around 1.0158, which led to a false breakout and a signal to buy the euro. As a result, the upward movement amounted to about 30 points and that was it.
When to go long on EUR/USD:
The euro remains locked in a horizontal channel, as strong US statistics continue to keep demand for the dollar even in the face of excessive inflationary pressure and the onset of a recession in the economy. Today there are no statistics that can significantly affect the pair's direction, so I expect low volatility and trading within a narrow channel. Data on the indicator of investor confidence from Sentix on the euro area is unlikely to shake the market. I advise you to rely on the nearest levels: in case the pair drops to the area of the nearest support 1.0161, formed on the basis of last Friday, forming a false breakout will give the first signal to open long positions in hopes of building an upward trend with the prospect of updating the resistance of 1.0191, just above which the moving averages, playing on the side of the bears, pass. A breakthrough and test from top to bottom of this range will hit stop orders, creating another signal to enter long positions with the possibility of moving up to 1.0220, where large players will return to the market. The farthest target will be the area of 1.0253, where I recommend taking profits, but we are unlikely to be able to reach this level today, especially after Friday's data on the US labor market.
If the EUR/USD falls and there are no bulls at 1.0161, the pressure on the pair will increase, which will open the way to the lower border of the wide horizontal channel at 1.0124 - a real struggle will unfold for it. If you miss this level, you can say goodbye to the July upward trend. The best option for opening long positions would be a false breakout at this level. I advise you to buy EUR/USD immediately on a rebound only from 1.0082, or even lower - in the region of 1.0045 with the goal of an upward correction of 30-35 points within the day.
When to go short on EUR/USD:
The bears felt a rather significant surge of strength after Friday's statistics, and now all they need is the completion of the Asian upward correction in the area of 1.0191. Forming a false breakout at this level will provide an excellent sell signal in continuation of Friday's trend with the prospect of a return to 1.0161. A breakthrough and consolidation below this range, as well as a reverse test from the bottom up - all this creates another sell signal with the removal of bulls' stop orders and a larger movement of the pair to the 1.0124 area, where bears will already have difficulties - it is unlikely that this level will be picked up just like that. Consolidating below this area is a direct road to 1.0082, where I recommend completely leaving short positions. A more distant target will be the area of 1.0045, but this is only after the bullish trend of July 14 is reversed.
If EUR/USD moves up during the European session, and there are no bears at 1.0191, I advise you to postpone short positions until 1.0220, as the bulls will most likely block almost all of Friday's downward movement, establishing a complete balance in the market. Forming a false breakout at 1.0220 will be a new starting point for entering short positions. You can sell EUR/USD immediately on a rebound from a high in the area of 1.0253, or even higher - from 1.0292, counting on a downward correction of 30-35 points.
COT report:
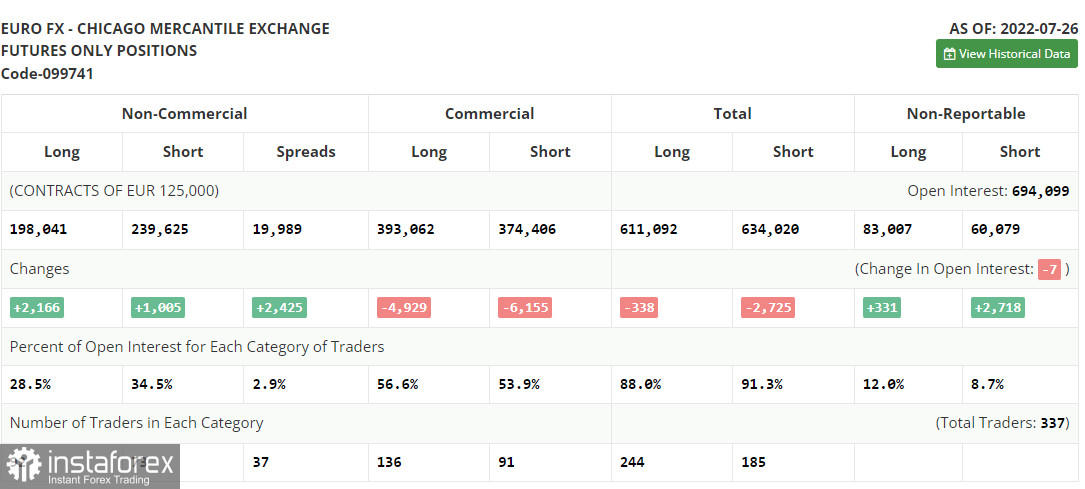
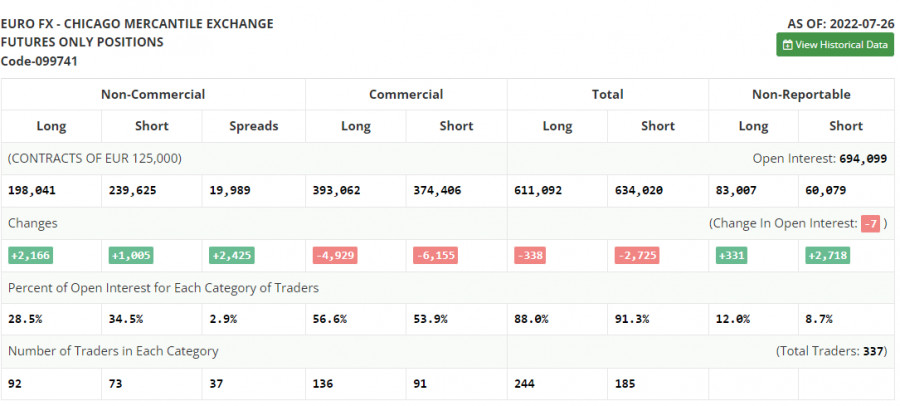
The Commitment of Traders (COT) report for July 26 logged an increase in both short and long positions, but the former turned out to be more, which indicates a gradual end of the bear market and an attempt to find a market bottom after reaching euro parity against the US dollar. Obviously, the data on the European economy that was released last week helped the euro to some extent. A slight acceleration in the growth of the consumer price index was offset by a sharp upsurge in the European economy in the second quarter of this year. GDP growth of 4.0% per annum surprised many economists, which supported the bullish mood of traders after the Federal Reserve hinted at a possible milder further cycle of interest rate hikes. All this will make it possible for us to count on further upward movement of the EUR/USD pair. The COT report shows that long non-commercial positions rose by 2,166 to 198,041, while short non-commercial positions jumped by 1,005 to 239,625. At the end of the week, the overall non-commercial net position, although it remained negative, rose slightly from -42,745 to -41,584. The weekly closing price decreased and amounted to 1.0161 against 1.0278.
Indicator signals:
Moving averages
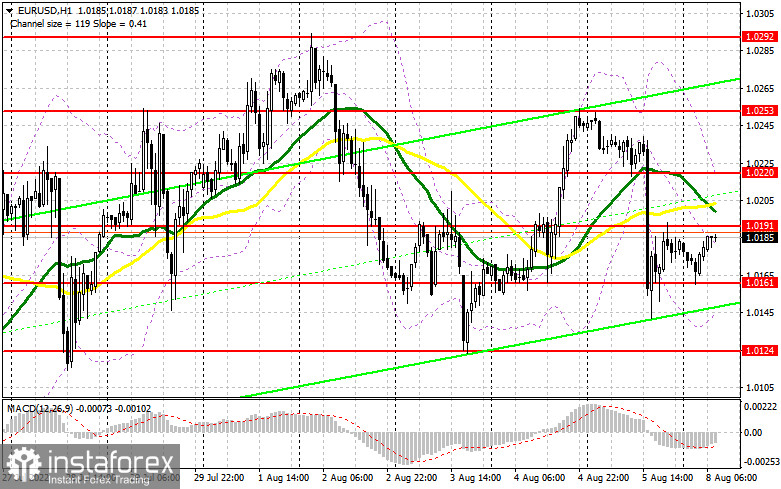
Trading is below the 30 and 50-day moving averages, indicating the bears' attempt to show their strength.
Note: The period and prices of moving averages are considered by the author on the H1 hourly chart and differs from the general definition of the classic daily moving averages on the daily D1 chart.
Bollinger Bands
In case of a decline, the lower border of the indicator around 1.0140 will act as support. In case of growth, the upper border of the indicator in the area of 1.0220 will act as resistance.
Description of indicators
- Moving average (moving average, determines the current trend by smoothing out volatility and noise). Period 50. It is marked in yellow on the chart.
- Moving average (moving average, determines the current trend by smoothing out volatility and noise). Period 30. It is marked in green on the chart.
- MACD indicator (Moving Average Convergence/Divergence — convergence/divergence of moving averages) Quick EMA period 12. Slow EMA period to 26. SMA period 9
- Bollinger Bands (Bollinger Bands). Period 20
- Non-commercial speculative traders, such as individual traders, hedge funds, and large institutions that use the futures market for speculative purposes and meet certain requirements.
- Long non-commercial positions represent the total long open position of non-commercial traders.
- Short non-commercial positions represent the total short open position of non-commercial traders.
- Total non-commercial net position is the difference between short and long positions of non-commercial traders.