Analyzing Wednesday's trades:
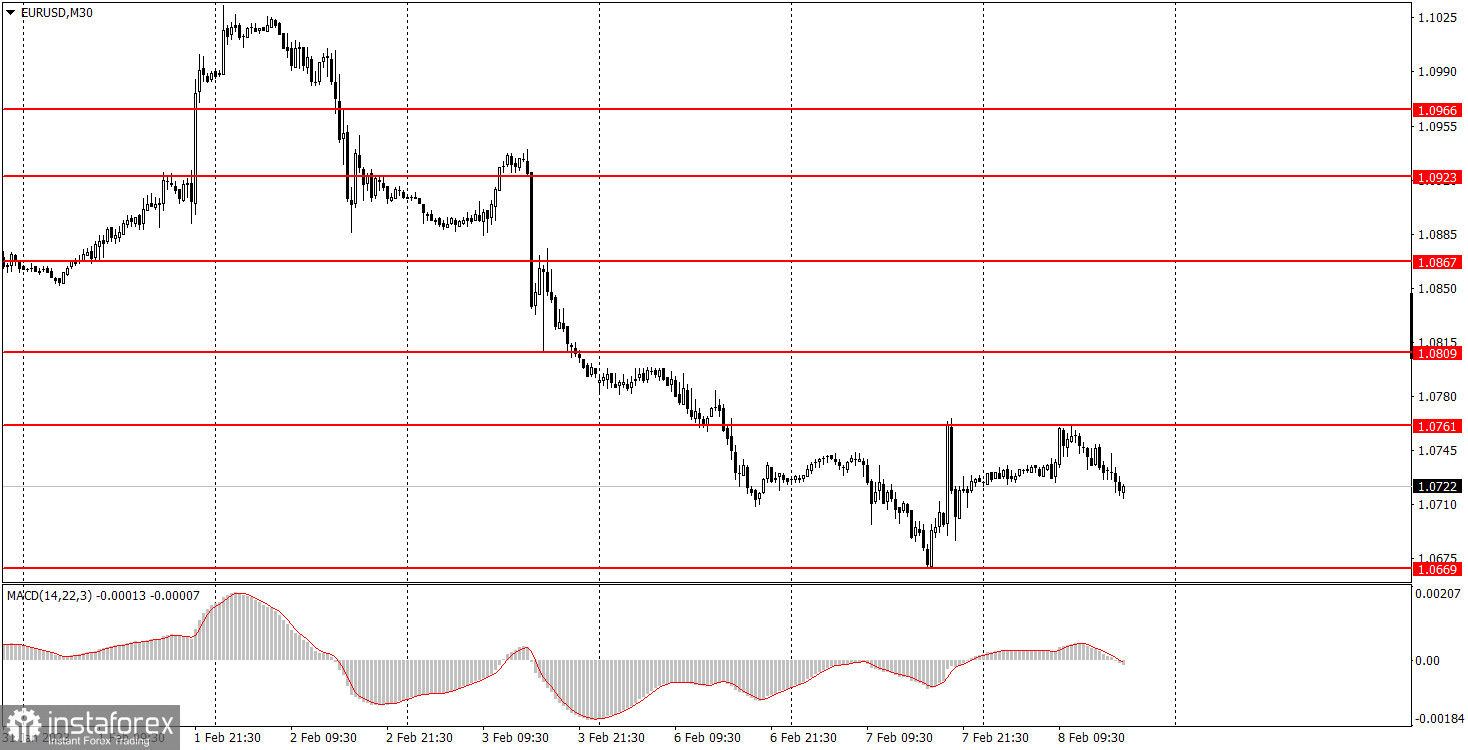
EUR/USD on 30M chart
On Wednesday, EUR/USD tried to continue the correction that it also tried to start on Tuesday evening. The speech of Federal Reserve Chairman Jerome Powell at the economic forum in Washington caused quite a strong market reaction, although he did not say anything extravagant. Powell did hint at a possible stronger tightening of the monetary policy, but the dollar managed to fall in price. Generally, we consider Powell's statement as a passing one, and we think that the market just needed a reason to stop the pair's downward momentum. But then the price failed to break through Tuesday's high at 1.0761 and started another decline during the US session. There were no macroeconomic and fundamental backgrounds, so the movements were purely technical. It did not settle above the first barrier, so it can now move down. Or a flat between 1.0669 and 1.0761 may occur, which is even more likely, considering the empty calendar this week.
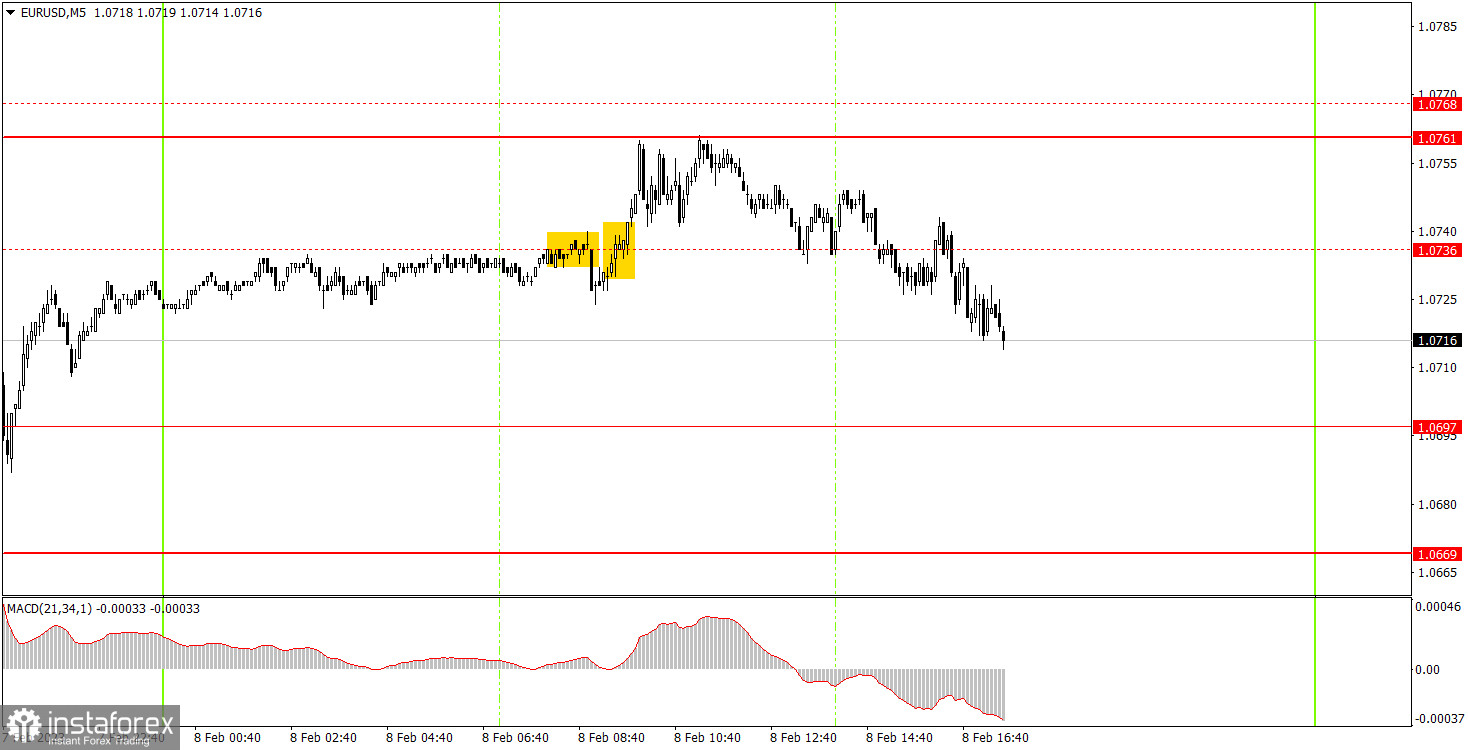
EUR/USD on M5 chart
I don't even want to talk about the trading signals on Wednesday. The movement was so crooked that it is surprising that so few false signals were formed. Some levels were rearranged, the signals were formed only near 1.0736, which was considered irrelevant by the end of the day. Therefore, beginners could try to use only the first two signals out of the whole pile. Both turned out to be false, and the price was able to pass in the right direction by 15 points only for the second time. Therefore, the long position closed at Stop Loss, which is already a good thing. The first short position closed with a small loss. Let me remind you that losing trades are not a problem, they happen from time to time. The main thing is to have more profitable deals and profit on them should be higher than the loss on unprofitable ones.
Trading tips on Thursday:
On the 30-minute chart, the pair continues to fall and it is not going to stop there. I expect an even sharper fall from the euro since it has been rising for a long time for no reason. There is no trend line or channel yet, we need a bullish correction to form a second pivot point. The pair can also go flat. On the 5-minute chart, it is recommended to trade at the levels 1.0535, 1.0587-1.0607, 1.0669, 1.0697, 1.0761, 1.0809, 1.0857-1.0867. As soon as the price passes 15 pips in the right direction, you should set a Stop Loss to breakeven. There will be only secondary events in the EU and America on Thursday. German inflation for January, Luis de Guindos speech from the ECB and US jobless claims. It is unlikely that any of these events will cause a strong reaction.
Basic rules of the trading system:
1) The strength of the signal is determined by the time it took the signal to form (a rebound or a breakout of the level). The quicker it is formed, the stronger the signal is.
2) If two or more positions were opened near a certain level based on a false signal (which did not trigger a Take Profit or test the nearest target level), then all subsequent signals at this level should be ignored.
3) When trading flat, a pair can form multiple false signals or not form them at all. In any case, it is better to stop trading at the first sign of a flat movement.
4) Trades should be opened in the period between the start of the European session and the middle of the US trading hours when all positions must be closed manually.
5) You can trade using signals from the MACD indicator on the 30-minute time frame only amid strong volatility and a clear trend that should be confirmed by a trendline or a trend channel.
6) If two levels are located too close to each other (from 5 to 15 pips), they should be considered support and resistance levels.
On the chart:
Support and Resistance levels are the levels that serve as targets when buying or selling the pair. You can place Take Profit near these levels.
Red lines are channels or trend lines that display the current trend and show in which direction it is better to trade now.
The MACD indicator (14, 22, and 3) consists of a histogram and a signal line. When they cross, this is a signal to enter the market. It is recommended to use this indicator in combination with trend patterns (channels and trendlines).
Important announcements and economic reports that can be found on the economic calendar can seriously influence the trajectory of a currency pair. Therefore, at the time of their release, we recommend trading as carefully as possible or exiting the market in order to avoid sharp price fluctuations.
Beginners on Forex should remember that not every single trade has to be profitable. The development of a clear strategy and money management is the key to success in trading over a long period of time.