To open long positions on EURUSD, you need:
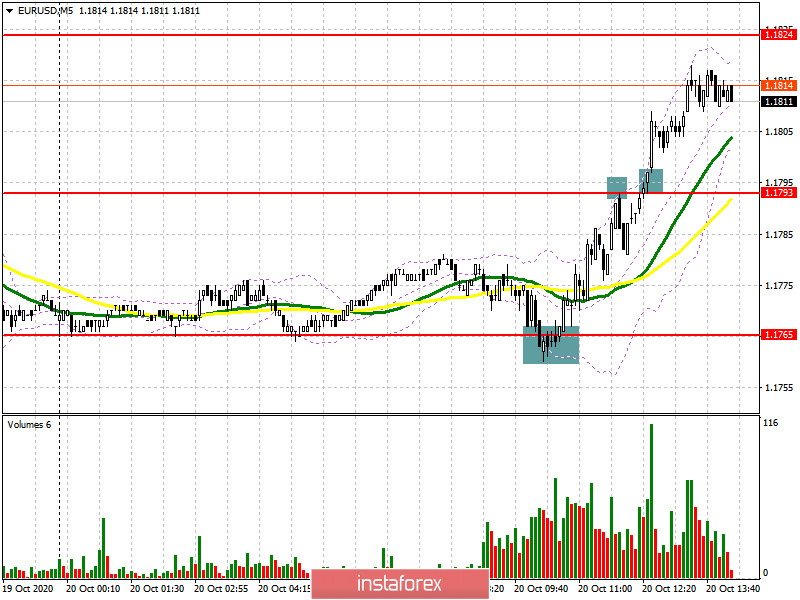
The lack of important fundamental statistics today helps the European currency to continue its growth against the US dollar. However, you should be careful because the entire movement may end faster than many expect without the support of major players. Especially a lot of questions are raised by the large divergence that is formed on the MACD indicator. As for trades in the first half of the day, a false breakout at the level of 1.1765 led to the formation of a good entry point into long positions. On the 5-minute chart, I marked this entry point. As a result, the pair quickly reached the next resistance of 1.1793, where the bulls continued their active purchases, taking this level as well.

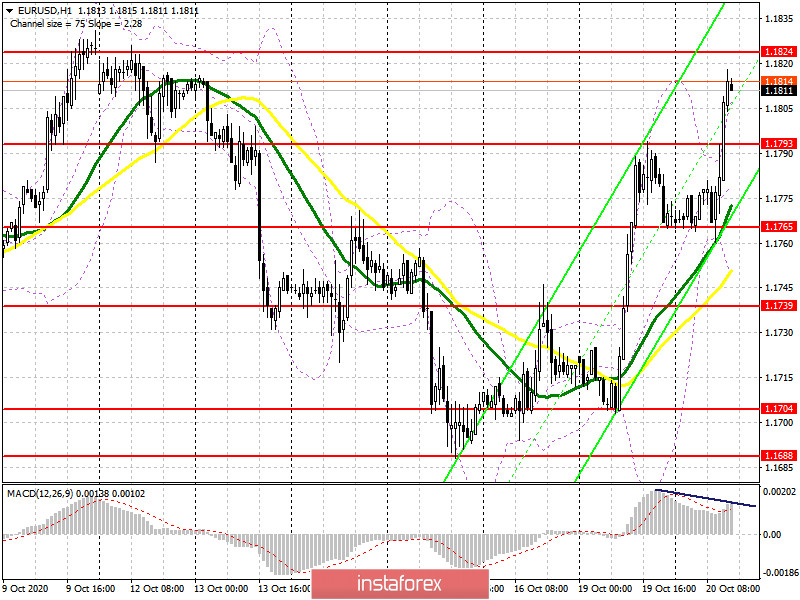
Now the "X" hour has come for euro buyers. A large divergence that is now formed on the MACD indicator can hit the euro's growth very hard. Therefore, the bulls have only one chance – this is a major breakdown of the resistance of 1.1824, which will lead to the formation of a new signal to open long positions in the expectation of updating the highs in the area of 1.1868 and 1.1915. If there is no activity from buyers at the level of 1.1824 in the second half of the day, it is best to wait for the pair to correct to the support of 1.1793. However, there is no need to rush to buy euros from this level. It is best to wait for the formation of a false breakout or postpone purchases for a rebound from the low of 1.1739 or even lower from the support of 1.1704, which almost coincides with the low of last week.
To open short positions on EURUSD, you need to:
Sellers will try to protect the resistance of 1.1824, as this is the last chance for them to return to the market. However, do not rush to sell euros. It is best to wait for the formation of a false breakout in the area of 1.1824, which will lead to confirmation of bearish divergence on the MACD indicator and the formation of a larger downward wave in the support area of 1.1793. An equally important task for the bears to return the initiative to their own hands will be to break through this range, fixing under which will form a new sell signal for EUR/USD with the main goal of testing the minimum in the area of 1.1765. If the bulls are stronger in the second half of the day, it is best to postpone sales until the high of 1.1868 is updated, based on a correction from it of 15-20 points within the day.
Let me remind you that the COT report (Commitment of Traders) for October 13 recorded a reduction in long positions and an increase in short ones, which led to an even greater decrease in the delta. However, buyers of risky assets believe in the continuation of the bull market, but prefer to proceed cautiously, as there is no good news on the Eurozone yet. Thus, long non-profit positions fell from 231,369 to 228,295, while short non-profit positions rose from 57,061 to 59,658. The total non-commercial net position fell to 168,637 from 174,308 a week earlier, indicating a wait-and-see position for new players. However, the bullish sentiment for the euro remains quite high in the medium term. The stronger the euro declines against the US dollar at the end of this year, the more attractive it will be for new investors.
Signals of indicators:
Moving averages
Trading is conducted above 30 and 50 daily moving averages, which indicates an active attempt by euro buyers to continue growth.
Note: The period and prices of moving averages are considered by the author on the hourly chart H1 and differ from the general definition of the classic daily moving averages on the daily chart D1.
Bollinger Bands
If the pair declines, the average border of the indicator in the area of 1.1780 will provide support.
Description of indicators
- Moving average (moving average determines the current trend by smoothing out volatility and noise). Period 50. The graph is marked in yellow.
- Moving average (moving average determines the current trend by smoothing out volatility and noise). Period 30. The graph is marked in green.
- MACD indicator (Moving Average Convergence / Divergence - moving average convergence / divergence) Fast EMA period 12. Slow EMA period 26. SMA period 9
- Bollinger Bands (Bollinger Bands). Period 20
- Non-profit speculative traders, such as individual traders, hedge funds, and large institutions that use the futures market for speculative purposes and meet certain requirements.
- Long non-commercial positions represent the total long open position of non-commercial traders.
- Short non-commercial positions represent the total short open position of non-commercial traders.
- Total non-commercial net position is the difference between the short and long positions of non-commercial traders.