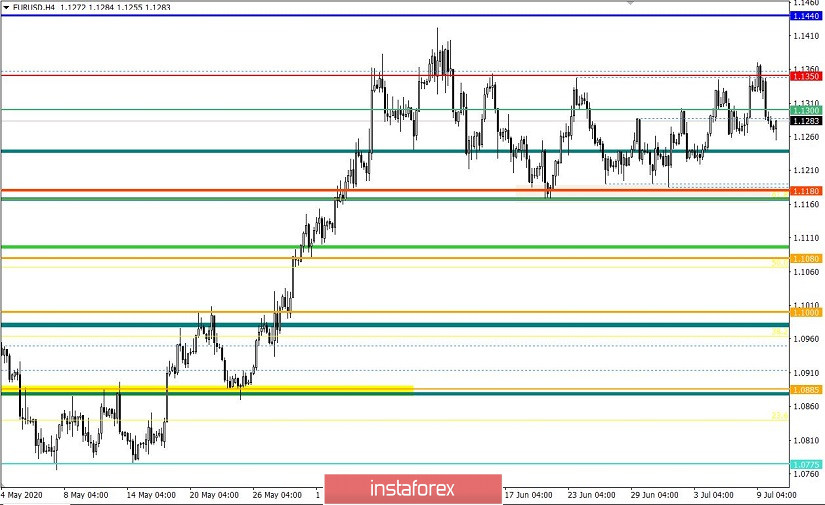
The current trading week is coming to an end. Looking back to the events that occurred, we can see that there were attempts to change the horizontal stroke of the market cycle, which ended in failure. Nevertheless, the quotes managed to consolidate above the level of 1.1350, but market participants failed to hold at this height, which resulted to a descent to the limits of the previous fluctuation.
The main issue of traders is the possibility that the range 1.1180 // 1.1250 // 1.1350 will remain in the market. Such is due to the speculative mood of market participants, which enabled the quotes to consolidate above the level of 1.1350. But in order to pass the area of interaction of trade forces 1.1400 // 1.1440 // 1.1500, the quotes do not just need speculation, but also the support of news and technical factors, which are unfortunately not available at the moment. Thus, the resumption of fluctuations within the boundaries of 1.1180 // 1.1250 // 1.1350 has a high probability of occurring once again.
Analyzing the past day in detail, we can see two turns of short positions, in which the first one appeared at the start of the European session, which led to a recovery. Meanwhile, the second round of short positions appeared at the start of the American trading session, which coincided with the flow of statistics.
Hence, a volatility of 12% was recorded, which is relative to the average daily value of 80 -> 90 points. At the same time, if we analyze the average daily dynamics from the spring of the current year to the current month, we can see that the indicator has halved, which means that the market has practically taken control of the speculative mood, which benefits both technical analysis and fundamental analysis.
Meanwhile, as discussed in the previous review, traders expected a similar development in the market, after the quotes consolidated below 1.1350. The trading idea last Thursday was followed, and the first goal of it was reached.
Thus, analyzing the trading chart in general terms (the daily period), we will see a slight stagnation relative to the earlier movement. Major changes in the trend are still far away.
As for news published yesterday, the indicators on the US labor market was published, in which according to reports, the number of initial applications for unemployment benefits were much better than all expectations, dropping to 1,314,000, lower than the forecast of 1,380,000. Previous indicators were also reviewed for the better, from 1,427,000 to 1,413,000. With regards to repeated applications, the figure decreased by 698,000 to 18,062,000, much lower than the forecast of 18.95 million. Its previous data was also revised for the better from 19.2 million to 18.76 million.
Such figured indicate there recovery of the United States, despite the continued high rates of coronavirus infection in the country. It surprised investors so much that at the time of publication of the data, the quote hovered in consolidation, and then strengthened in an hour.
In addition, the speech of US Treasury Secretary Steven Mnuchin also supported the US dollar, as he announced the possibility of another round of support for the US economy worth $ 660 billion. It will target businesses that really need help, as well as small businesses. Mnuchin said that the Ministry of Finance is working to ensure that the bill was approved by the Congress before the end of July.
Meanwhile, in Europe, Governor Francois Villeroy de Galhau of the ECB said that the regulator is ready to use more innovative monetary policy instruments, if bank sees it necessary.
"To fulfill its mandate of price stability over time, the Eurosystem will keep interest rates and liquidity at a very favorable level. The ECB is still ready to be as innovative as necessary with regard to its instruments, "Villeroy said.
Today, data on producer prices in the United States will be published, which should slow down from -0.8% to -0.3%, and possibly to -0.2%. It will lead to the strengthening of the US dollar, if the real data coincides with the forecast.
The upcoming trading week will be very busy, as during it, the final data on inflation in the EU and the US will be published. In addition, the ECB will conduct a meeting next week, after which is a press conference.
Here are the most significant events for next week (UTC + 1):
Tuesday, July 14
EU 10:00 - Industrial production index
US 13:30 - Data on inflation
Wednesday, July 15
US 14:15 - Industrial production index
Thursday, July 16
EU - ECB meeting, followed by a press conference
US 13:30 - Retail sales index
US 13:30 - Applications for unemployment benefits
Friday, July 17
EU 10:00 - Data on inflation
US 13:30 - Number of building permits issued (June)
US 13:30 - Volume of construction of new houses (June)
Further development
Analyzing the current trading chart, we can see that in the period earlier, the price reached the area 1.1260 / 1.1280, where a slowdown has occurred. In order to maintain the bearish mood, the quote has to consolidate lower than 1.1250, else, there will be a deviation to the level of 1.1300.
As for market sentiment, speculative positions are visible, but they are playing to the advantage of consistently high volatility.
Thus, it can be assumed that the area 1.1260 / 1.1280 will continue to put pressure on short positions, but if data on producer prices in the United States came out good, another round of sales may arise, on the basis of which a breakout from the level of 1.1250 will occur, moving in the direction of 1.1200-1.1190.
So, based on the above information, here are our trading recommendations:
- Sell positions lower than 1.1250, with the prospect of a move to 1.1200-1.1190.
- Buy positions if there is a local rebound towards 1.1290-1.1300.
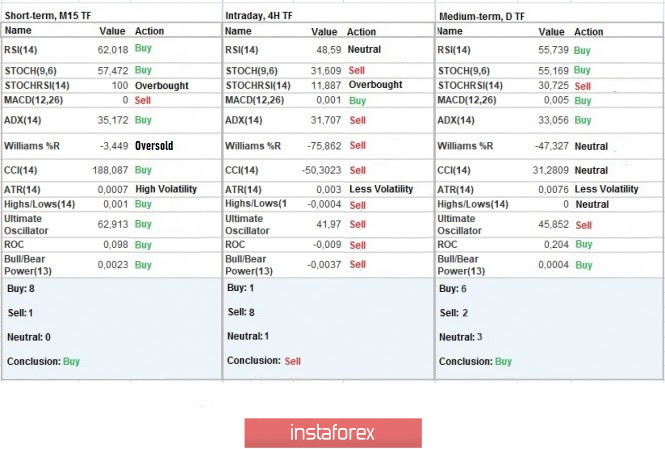
Indicator analysis
Analyzing the different sectors of time frames (TF), we can see that the indicators in the M15 chart signal buy due to the upcoming local rebound from the mirror level. The H1 chart, on the other hand, signal sell due to the upcoming recovery from the level of 1.1350. As for the D1 chart, the signal remains buy, but it will change if the price becomes lower than 1.1250.
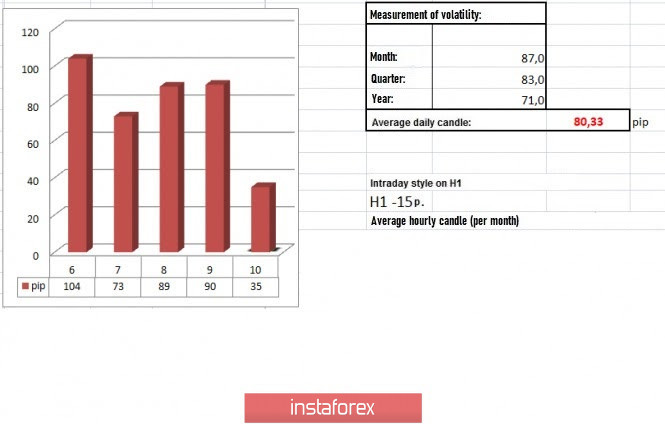
Volatility per week / Measurement of volatility: Month; Quarter Year
The measurement of volatility reflects the average daily fluctuation calculated by Month / Quarter / Year.
(July 10 was built, taking into account the time the article is published)
The volatility in this current time is 35 points, which is 56% lower than the average daily value. Thus, it is assumed that when the quotes breakout of the mirror level, another acceleration will occur.
Key levels
Resistance Zones: 1.1350; 1.1440 / 1.1500; 1.1650 *; 1.1720 **; 1.1850 **; 1,2100
Support areas: 1.1250 *; 1.1180 **; 1.1080; 1,1000 ***; 1.0850 **; 1.0775 *; 1.0650 (1.0636); 1,0500 ***; 1.0350 **; 1,0000 ***.
* Periodic level
** Range Level
*** Psychological level