To open long positions on EURUSD, you need:
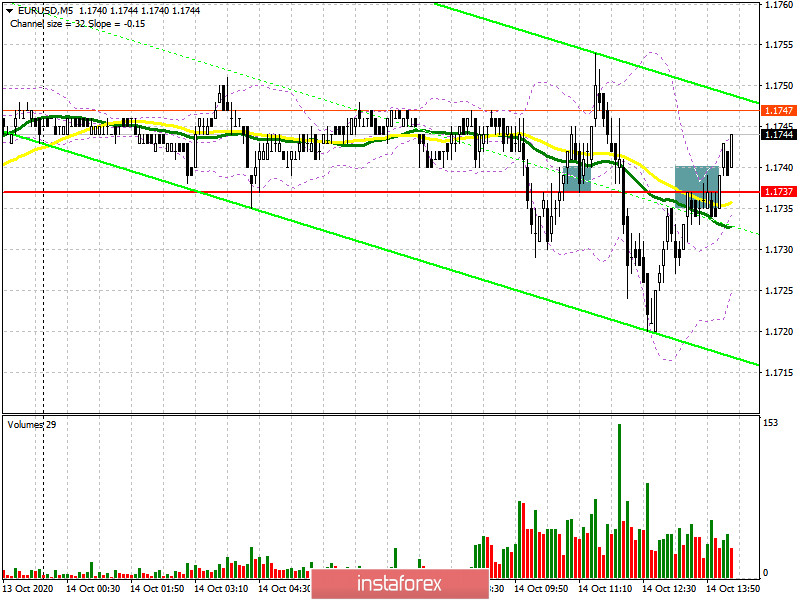
In the first half of the day, I paid special attention to the formation of a false breakout at 1.1737, as well as to the divergence that can be formed as a result of updating the daily minimum. Let's look at the 5-minute chart and analyze the entry points to the market. A false breakout and a return to 1.1737, along with the divergence of the MACD indicator, led to the formation of a good entry point for long positions. However, the pair did not grow significantly. After that, against the background of a weak report on industrial production in the Eurozone, the bears again returned EUR/USD to the level of 1.1737, trying to form a signal to open short positions from the resistance of 1.1737, which failed.

At the moment, the support and resistance levels have changed slightly. Now the focus of buyers is shifted to resistance and consolidation above this level, which forms a good entry point for long positions in the expectation of updating the highs in the area of 1.1789 and 1.1824, where I recommend fixing the profits. If the pressure on the pair returns in the second half of the day, and this may happen after the release of data on US producer prices, there is no need to rush to open long positions from the minimum of 1.1722. It is best to wait for the formation of a false breakout and only then buy the euro. If there is no activity on the part of the bulls, I recommend that you postpone long positions until the minimum of 1.1688 is updated, based on a correction of 20-30 points within the day.
To open short positions on EURUSD, you need to:
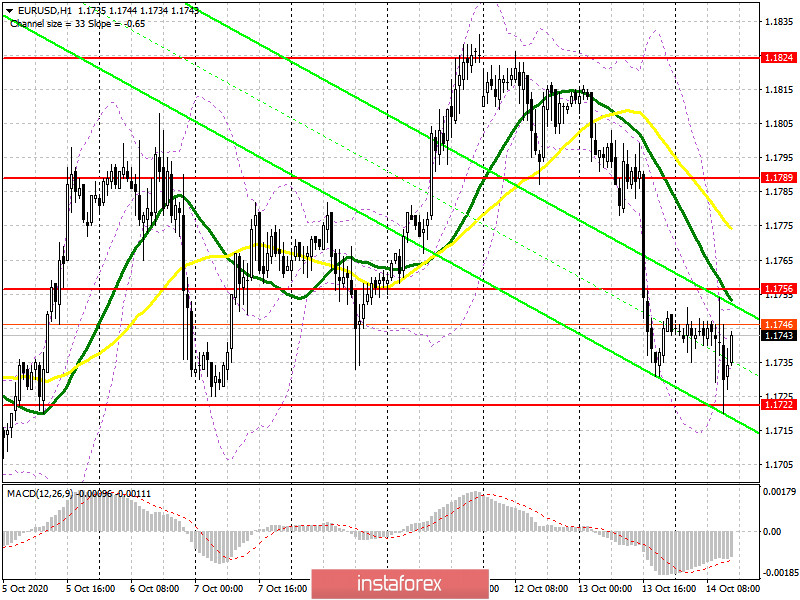
The pressure on the euro has eased, however, this does not mean that buyers have returned to the market. The bears need some time to build up new short positions. The market went down too fast yesterday. The formation of a false breakout in the second half of the day at the level of 1.1756 will be a signal to sell the euro to return to the support area of 1.1722. However, the more important task of the bears will be to break and consolidate below this level, the test of which from the bottom up forms an excellent entry point into short positions to further reduce the euro to the area of the minimum of 1.1688, where I recommend fixing the profits. In the scenario of no bear activity at the level of 1.1756, it is best to postpone sales until the test of a larger resistance of 1.1789, where you can open short positions immediately for a rebound in the expectation of correction of 20-30 points within the day.
Let me remind you that the COT report (Commitment of Traders) for October 6 recorded a reduction in long positions and an increase in short ones, which led to an even greater decrease in the delta. Buyers of risky assets believe in the continuation of the bull market, but prefer to proceed cautiously, as there is no good news on the Eurozone and the pace of economic recovery yet. Thus, long non-commercial positions decreased from the level of 241,967 to the level of 231,369, while short non-commercial positions increased from the level of 53,851 to the level of 57,061. The total non-commercial net position fell to 174,308, compared to 188,116 a week earlier, which indicates a wait-and-see attitude of new players. However, bullish sentiment for the euro remains quite high in the medium term.
Signals of indicators:
Moving averages
Trading is conducted below 30 and 50 daily moving averages, which keeps the chance of a further decline in the pair.
Note: The period and prices of moving averages are considered by the author on the hourly chart H1 and differ from the general definition of classic daily moving averages on the daily chart D1.
Only a break of the upper limit of the indicator in the area of 1.1830 will lead to a new wave of growth of the European currency.
Description of indicators
- Moving average (moving average determines the current trend by smoothing out volatility and noise). Period 50. The graph is marked in yellow.
- Moving average (moving average determines the current trend by smoothing out volatility and noise). Period 30. The graph is marked in green.
- MACD indicator (Moving Average Convergence / Divergence - moving average convergence / divergence) Fast EMA period 12. Slow EMA period 26. SMA period 9
- Bollinger Bands (Bollinger Bands). Period 20
- Non-profit speculative traders, such as individual traders, hedge funds, and large institutions that use the futures market for speculative purposes and meet certain requirements.
- Long non-commercial positions represent the total long open position of non-commercial traders.
- Short non-commercial positions represent the total short open position of non-commercial traders.
- Total non-commercial net position is the difference between the short and long positions of non-commercial traders.