


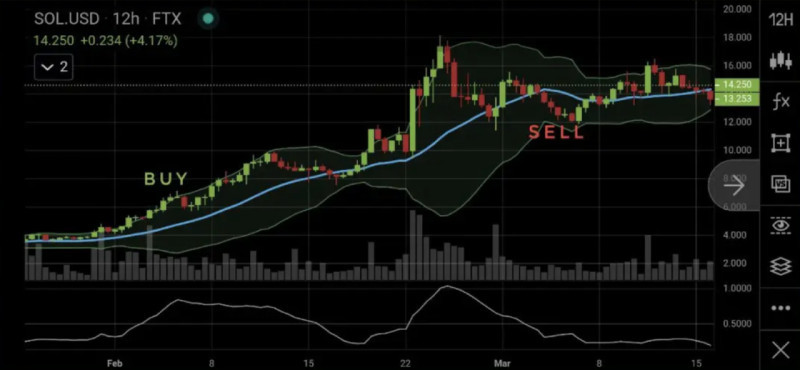
Get to know Bollinger bands and the principles of their efficient application to financial markets. Read comprehensive guidance on how to gain profits with the help of the popular indicator. Traders are certainly aware of the advice: use a few indicators on the same chart. Indeed, they should confirm or filter trading signals. You can learn about the types of indicators and how they can interact with each other in the article "Best Forex indicators".
In this article, we will introduce you to one of the most curious indicators, Bollinger Bands (BB).
Basics of Bollinger Bands
This indicator is named after the person who invented it: John Bollinger, a renowned financier and analyst. He developed his system and along with it his own indicator over 30 years ago.
After spending about seven years creating his brainchild, John Bollinger brought it to perfection. His idea quickly gained popularity among traders and has been successfully used to this day.
The indicator itself belongs to the category of trend-following indicators. However, it allows you to determine not only the direction of movement of the price of an asset but also its speed.
Bollinger Bands include three bands that enable traders to recognize the strength and direction of the trend, as well as market volatility.
Let’s try to figure out what these lines are and how they are shaped. The line located in the middle is a 20-period moving average, that is, it calculates the average price over a period of 20 candles.
The upper and lower bands are located at an equal distance from the midline. Together they form a corridor where the chart develops.
The location of the upper and lower borders is determined automatically, taking into account the formula embedded in the indicator. We will talk about it a bit later.
The area between the upper and lower borders can either expand or contract.
At the same time, the expansion of this corridor means an increase in market volatility. This can happen, for example, after the release of important news. The area is narrowed in case market volatility ebbs away.
According to the author's idea, this indicator is not intended for constant monitoring of price fluctuations. This is not the tool that will help determine how the price will move at any time.
However, there are certain signals that it periodically generates, allowing you to make successful transactions.
Pros and cons
Like any other indicator, Bollinger Bands are not perfect. They have both their positives and negatives.
Let's start with the advantages of this indicator:
- Versatility. Bollinger Bands can be used in trading on any markets, including Forex, as well as on any time frame from a minute to a day.
• Easy use. Even beginners can use this indicator, since its signals are quite clear. The narrowing of the channel indicates a slowdown in the market, and its expansion, on the contrary, indicates an active movement.
• Interaction with Japanese candlesticks. The contact of lines with certain types of candles indicates a particular situation in the market. Experienced traders use these signals to make profitable trades.
The outer bands of the channel can be used as support and resistance lines.
• It allows you to determine the continuation or reversal of the trend. This is done by looking for certain patterns on the chart, the so-called letters W and M.
Among the main disadvantages, traders point out the following:
- Delay. This feature is typical for all moving averages. Here, they are the bedrock of this indicator.
• It requires the use of other indicators. In addition to BB, other indicators must be applied to obtain reliable information.
• It does not suit the flat market. The indicator behaves best when there is a clear-cut trajectory of price movement. When an instrument is trading sideways, a trader may be confused by numerous false signals.
• Lack of prompts for setting the Stop Loss level.
How to apply Bollinger bands
An essential rule for the application of this indicator: in 95% of cases, price fluctuations should be inside the corridor and only in 5% of cases - outside it.
At the same time, the price can also periodically go beyond the borders. It other words, the price may break through the boundaries of the corridor.
As we already mentioned that Bollinger Bands are not a completely self-sufficient indicator. To obtain correct information, you need to supplement it with other indicators. RSI, MACD, and Stochastic work well with it in tandem.
At the same time, there are no restrictions on timeframes for this analytical tool. It can be used on any timeframes: 1 minute, 1 hour, daily, etc.
A high degree of visibility makes it easy to read information from this indicator. When the channel expands, it means further continuation of the trend.
When the outer bands of the corridor approach each other and the corridor narrows, this means that the trend is fading and a flat is coming.
You can identify the direction of the trend through the ratio of the price chart itself to the middle line. If the price chart is higher, it means the uptrend. If the chart is below this line, it indicates the downtrend.
If the price started its move touching one of the borders of the corridor, then with a high degree of probability it will reach the second border.
To determine a potential trend reversal, the author of this indicator also came up with special "techniques". These are the letters W and M in the chart.
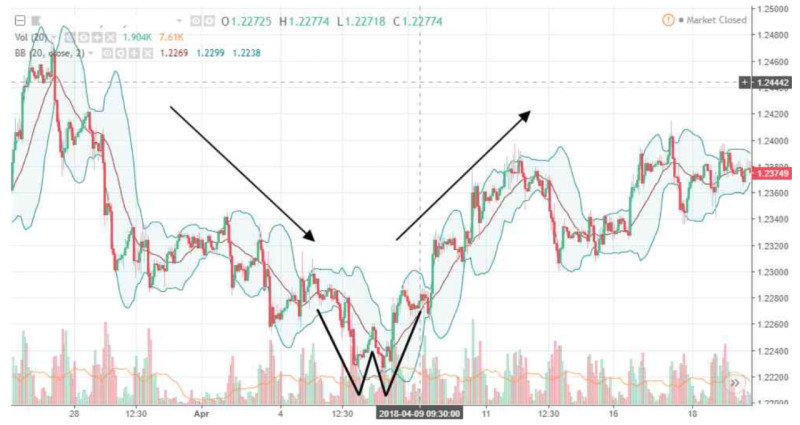
Shapes in the form of the letter W are located at the bottom of the chart and indicate a change in the trajectory from a downtrend to an uptrend. At the same time, the shape does not always look perfect, but the outlines of the letter W can be spotted.
First, the price goes down and crosses the lower line. Then, it rises to the middle line. The price could cross it, and then again it falls to the lower line and rebounds from it. Thus, the trend has changed direction.
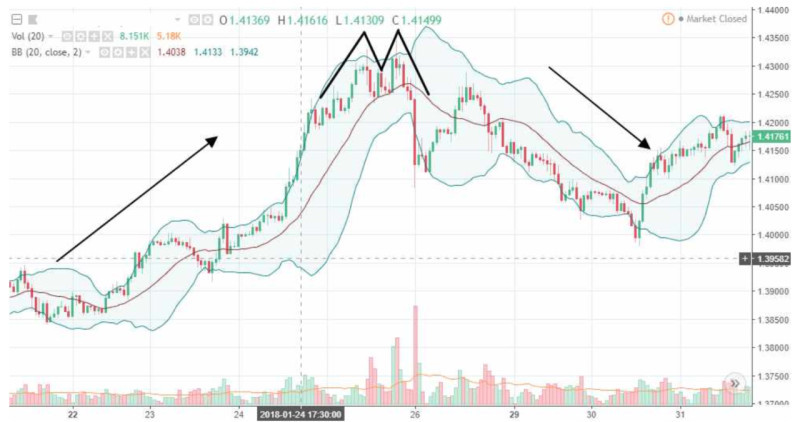
Likewise, shapes in the form of the letter M can be recognized on the chart. They are located in the upper part of the chart, and their presence indicates a change in the direction of the trend from rising to falling.
First, the price rises a little but does not reach the upper border of the corridor, then it goes down to the middle line, it can cross it, and then the price rises again, but not as high as during the previous rise and after that it starts to decline.
Bollinger Bands’ strategy
If you want to become a truly successful trader, you need a good and reliable trading strategy. Some traders follow their gut feeling, and sometimes they are actually successful.
However, intuition alone is not enough to make more gainful trades than unsuccessful ones. We need a certain system, a trading plan with clearly laid down rules.
When you have a clear plan of action, you feel confident in any situation. You don't panic if one or more trades go wrong.
You can take any principles as the cornerstone of a trading strategy. You can rest your strategy on some indicators or invent it without indicators. As a rule, traders use some combination of technical and fundamental analysis.
If you are closer to methods that use technical analysis, namely indicators, it would be a good idea to devise a trading system based on Bollinger Bands.
As we have already mentioned, this indicator behaves well at different time intervals. Therefore, it can be used both in short-term strategies, including scalping, and medium-term ones.
Short-term strategies involve opening and closing trades within one trading day. Scalping implies a large number of transactions lasting from several seconds to several minutes.
Medium-term strategies mean that trades can remain open for several days or even several weeks. This is a more relaxed type of trading.
However, experienced traders recommend using this indicator for short-term strategies, in particular, for scalping.
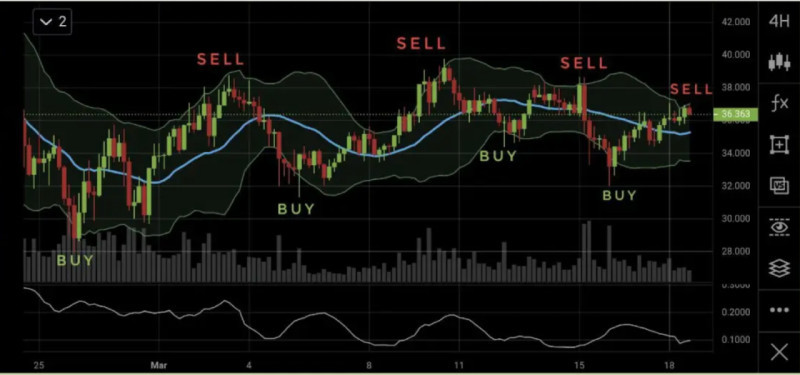
An instrument is traded within the area bounded by the upper and lower borders. As soon as the price reaches one of the above lines, you can open a deal to buy or sell.
In this case, you can take profit at the moment when the price passes through the line located in the middle, and not wait for touching one of the channel boundaries.
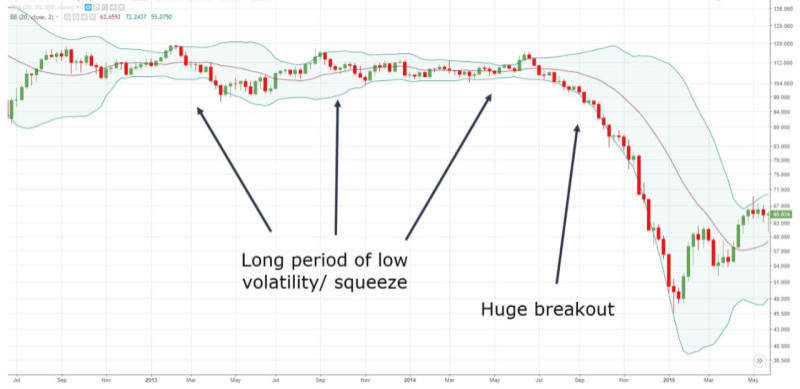
BB is a very strong indicator of market volatility. When the price stays within the channel for a long time, market volatility wanes and the channel narrows.
At the same time, the narrower the corridor becomes, there is a more likelihood that the price will soon begin a strong and active movement and go beyond the channel, making a breakout.
These breakouts provide excellent opportunities for a market entry. So, we may buy when the price breaks the upper border and sell when it breaks the lower border.
However, it is not recommended to open a trade when a breakout happened on one candle. It is better to wait until the signal is confirmed when at least three candles are above or below the channel borders.
Bollinger Bands’ trading signals
As with any other indicator, we are waiting for any signals from the BB indicator. On this ground, it will be possible to open a deal.
According to the author, the interaction between the price chart and Bollinger Bands should not be taken too simply and literally.
For example, if the price reached the upper band, this does not mean that you need to sell. As well as touching the lower band does not mean that you need to buy immediately.
In the settings of this indicator, there are 2 main components with which you can change the "behavior" of the indicator. This is the number of periods and the standard deviation.
If you use smaller timeframes, the indicator will respond almost instantly to price changes. In this case, the lines become less smooth.
Despite a large number of trading signals, many of them may turn out to be false. Moreover, the use of a moving average with a period of less than 10 is hardly efficient.
When choosing larger timeframes (over 20), the indicator responds to changes more slowly. Channel borders become smoother.
There is a much smaller number of signals, but they become more accurate.
By changing the standard deviation settings upwards, the outer borders part of the line is located in the middle.
With this setting, more price fluctuations happen inside the channel. The price chart can break through the channel borders less frequently.
As the standard deviation decreases, the distance between the outer borders also shrinks. The channel becomes narrower, and the price chart may cross borders more frequently.
With an increase in the standard deviation, BB produces more accurate and reliable signals than when it is changed downward.
Bollinger Bands’ formula
Nowadays, all calculations are made by means of software. A trader does not need to calculate each value of each component of the formula manually.
However, in order to better understand how the indicator operates, it is essential to know and understand what exactly is included in its algorithm. How is it calculated and what specifics can affect the accuracy of its readings?
To do this, we suggest looking at the formula for calculating each of the lines of this indicator. Let's start with the middle line, which is based on the formula:
ML = SUM (CLOSE, N) / N = SMA (CLOSE, N) where
the sum of the closing prices for the N number of periods is divided by the total number of these periods. As a result, we get the calculation of a simple moving average for the selected number of periods.
To calculate the upper border, the following formula is used:
TL = ML + (D * StdDev), где D is a number of standard deviations
The formula for the lower border is calculated in a similar way, but instead of a plus, a minus is indicated in it.
In this case, the standard deviation StdDev is calculated by the equation:
StdDev = SQRT (SUM ((CLOSE — SMA (CLOSE, N))^2, N)/N), where SQRT is a square root of that sum.
The standard deviation directly depends on the volatility of the market, so the lines themselves adjust their width, that is, the distance from the midline.
When the market is in motion and the price is making active movements, the lines diverge and the distance between them increases.
In more stable periods, when the market is flat, the lines converge and the distance between them becomes smaller.
Bollinger Bands vs Envelopes
These two indicators are similar. They are "brothers" in the category, as they relate to trend-following indicators.
Both of these indicators are popular among beginners as they are easy and straightforward to use. They both give visually clear and simple signals.
Both of these indicators are universal and can be used at any timeframes and for trading any assets. These are their common features.
Also, both of these indicators are based on several moving averages. The difference is only in the calculation of the location of the outer lines.
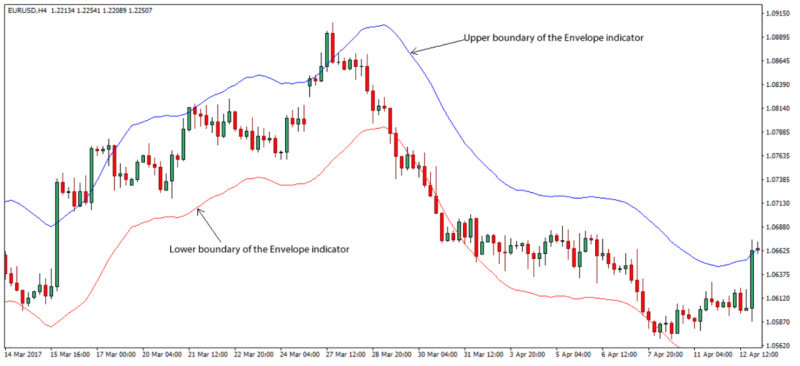
The Envelopes indicator differs from BB in that in the first case, the above bands are located at a given distance from the line located in the middle. This distance is expressed as a percentage.
In this case, the middle line is not always plotted on the chart. You can often see the Envelopes’ indicator as two bars.
In contrast, in the BB indicator, the outer lines of the channel are located at a distance that is calculated based on a given number of standard deviations. This makes these bands be self-adjusting and move.
The main principle of Envelopes is that the price, despite any fluctuations, again returns to its overall trajectory.
That is, if at some point, under the influence of any factors, the price rises or falls and, accordingly, reaches one of the outer lines, it will soon return to the average value level.
At the same time, these indicators can be used together on one chart. They will complement each other's signals.
Automation of Bollinger Bands
Computer technology has long been firmly entrenched in our lives. They greatly facilitate the performance of routine tasks that used to take a lot of time and effort.
Even the trading process as such is impossible without a gadget and a trading platform through which trading is carried out.
With the example of this indicator, we see that all calculations are carried out automatically. You only need to set the initial data. The program calculates everything on its own and gives the end result in the form of lines applied to the chart.
This is very convenient. The question is whether it is possible to make the trading process even easier. Yes, with the help of expert advisors and robots.
Expert advisors allow you not to waste time and effort on lengthy analysis. They themselves analyze the current situation on the market and give a signal to buy or sell an asset.
Trading robots, in addition to this, can not only generate signals but also independently make transactions from your account.
As we have already noted, there are two main strategies for working with Bollinger Bands: trading on a rebound or dip from the channel’s borders and trading on a breakout.
Importantly, it might take a long time for the price to move to the border or make a breakout. The process of touching the borders or their breakouts occurs in a fraction of a second.
This brief moment is easy for a trader to miss unless they are constantly near the monitor. This problem can be solved with the help of an adviser that will keep track of the situation and give a signal at the right time.
One of these Expert Advisors is Bollinger, which can be installed and used on the MetaTrader 5 trading platform. This Expert Advisor trades according to the strategy of rebounding from the outer bands of the channel.
How to use Bollinger bands with other indicators
We have already said that the BB indicator is not self-sufficient. To clarify its signals, it is recommended to use it alongside other indicators.
Since this one is a trend-following indicator, it tends to lag like other indicators of this group.
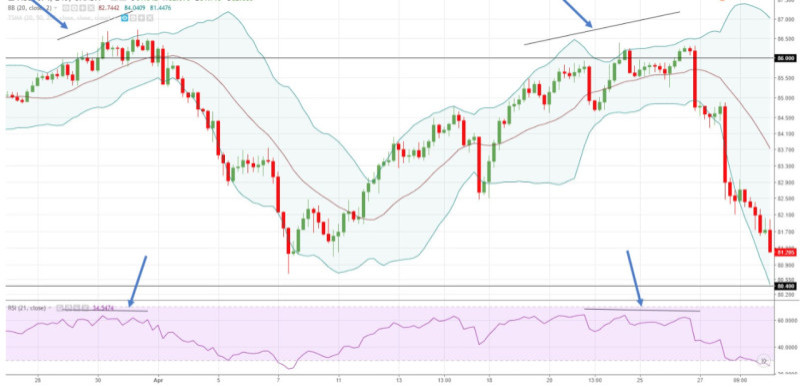
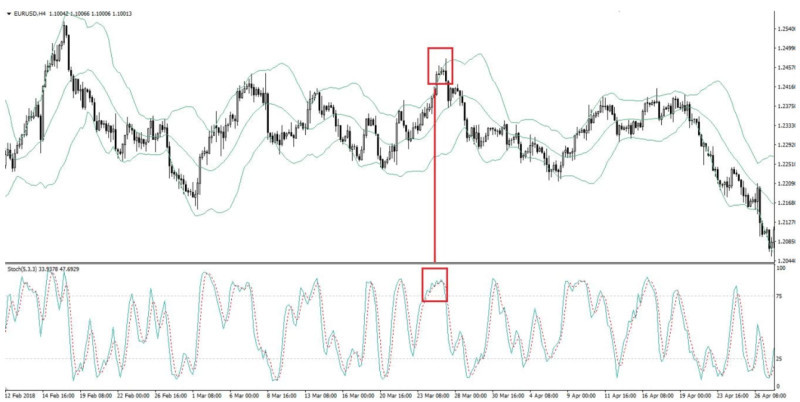
Oscillators being leading indicators come to the aid of trend-following indicators. Oftentimes, Stochastic and RSI are used in parallel to BB. Let's take a closer look at their interaction.
When using BB and RSI together, it is recommended to apply a scalping strategy on timeframes from M1 to M15.
The main buy and sell signals come from Bollinger bands. The RSI indicator is used to filter the signals received from the BB.
So, if the price of an asset reaches the upper border of the channel or crosses it, and at the same time RSI shows a lot of activity in the market, you need to either open a buy trade or add more to already available positions.
On the other hand, if the RSI does not confirm the signal from the BB, then, after the price touches the upper border, you need to open a sell position.
BB and Stochastic could be used in sync in the range-bound market. In this case, the oscillator is used to determine the overbought and oversold areas.
When the price touches one of the Bollinger Bands, you need to check the signal from the oscillator. If it is below 20%, it means that the asset is in the oversold zone, so you need to open a buy position.
In the opposite situation, when the Stochastic is above the 80% mark, it means the overbought zone, so we should open a sell position.
Savvy traders also recommend setting Stop Loss and Take Profit levels to minimize possible losses.
Setting Bollinger Bands
Each indicator can be customized for your trading preferences. BBs are no exception to this rule.
This indicator has standard, basic settings, which we have already mentioned: a 20-period moving average, and the outer borders of the channel with a standard deviation of +2 and -2, respectively.
Let’s consider which of the settings can be changed and what result it will give. You can change not only the period and the size of the standard deviation but also the source of the price and the shift on the chart.
A moving average with a period of 20 means that the last 20 bars on the chart, including the current one, are used for analysis. All calculations are carried out with them in focus.
You can change the periods for the moving average in the range from 13 to 24, although 20 is still considered the optimal value.
At the same time, a decrease in the number of periods makes the indicator more sensitive to price fluctuations. An increase in the number of periods, on the contrary, makes the indicator immune to fluctuations.
When changing this setting, you need to check how often the chart touches the outer lines.
If this happens too often, you need to increase the number of periods. If the price does not reach the borders, you need to reduce the number of periods.
As a rule, closing prices are used as a price source, but other values, such as weighted or typical prices, can also be used.
You can also try to change timeframes when using this indicator. On higher timeframes, it is easier to determine the moment of trend formation.
Having seen the formation of a trend, you can switch to shorter timeframes and find confirming signals, after which you can open a position.
Secrets and rules for using Bollinger bands
There are a few rules and secret tricks to using Bollinger Bands for the utmost efficiency. We recommend that you get to know them and take them into service.
1. Mature traders advise choosing a standard deviation of 2.5 rather than 2. This allows you to reduce the number of false signals and get more accurate signals.
2. Together with the change in the standard deviation, it is necessary to change the settings of the middle line, also upwards.
3. Do not use a period less than 10 for the line located in the middle, this will add too much unnecessary "noise" and will only bring confusion.
4. To confirm the signals, it is recommended to use oscillators as well as support and resistance levels together with BB.
5. If you are trading on a short timeframe (for example, M5) and get a signal to enter the market, use a longer timeframe (for example, M30) to test the signal.
6. To confirm signals and search for moments of a trend change, look for the formation of W- and M-shaped patterns on the chart.
7. Touching the outer borders of the channel is not yet a signal to enter or exit a position. It is necessary to compare the signal with the readings of other indicators.
8. When using the basic settings for the middle line and the borders of the corridor, 95% of price fluctuations should occur inside the corridor and only 5% can go beyond it.
9. If you have made changes to the standard BB settings, and prices touch or cross borders too frequently, or do not reach them at all, it means the indicator is not set up correctly and will produce false signals.
10. After the outer borders have narrowed notably, there is a likelihood that the price will change sharply in a particular direction.
11. If the price crosses the corridor and continues to move outside it, there is a high probability that the current trend will continue.
12. Price movement occurs within the corridor from the upper line down and vice versa. The price always strives to return from extremes to its average values.
Bottom Line
In this article, we introduced you to the main features as well as the pros and cons of using Bollinger Bands.
This indicator is popular because it is easy to use and interpret, as it clearly displays flood tide and ebb tide in market volatility.
At the same time, this indicator is not self-sufficient, and it must be complemented by other indicators, in particular oscillators.
The main strategies of applying BB are to trade on bounces or dips from the outer borders of the channel, as well as to trade on breakouts of the borders.
The standard settings embedded in the indicator can be changed if appropriate to receive more or fewer signals. However, remember that more signals are not always better.
In addition to analyzing the movement of the lines as such, you need to keep close tabs on the chart where you can find patterns that indicate a reversal or continuation of a trend.
You may also like:
Wolfe Waves
MFI Indicator (Money Flow Index)
Awesome Oscillator: how to use
Support and Resistance Indicator MT4, MT5
VWAP Indicator (Volume Weighted Average Price)
MT4 indicators: how to install and use
Candlestick patterns Indicator for MT4, MT5
Forex volume indicators for MT4, MT5
Forex arrow indicators for MT4
Forex trend indicators: TOP 6 (complete guide)


