


Technical analysis indicators are well-combined with each other, as they can confirm or filter each other's signals. Thus, volume indicators can show how popular an asset is among market participants.
The MFI is one of these indicators. Let’s now take a closer look at it.
To learn more about forex indicators, you can read the article "Forex indicators".
About MFI indicator
The MFI is a volume indicator that measures the flow of money into and out of a security. This indicator is not plotted on the price chart but on the chart in a separate window. It is often compared to the RSI (Relative Strength Index), although the latter does not measure trading volumes.
It is impossible to determine actual trading volumes on Forex. Meanwhile, tick volumes, fluctuations in the value of an asset over a certain period of time, are calculated.
Each fluctuation equals 1 completed trade, regardless of its actual volume. Whether it is a $1 trade or a $10,000 trade, it still counts as one tick.
Therefore, distortion may occur. To smooth out distortions, higher time frames should be analyzed.
There are so-called financial inflows and outlows in the market. Inflows and outflows contribute to an increase and a decrease in the price of an asset respectively.
The MFI shows both the current price of an asset and its previous values. Thus, there is an inflow when the current price is above the previous one, which means more traders buy this asset.
Conversely, it is an outflow when the current price is below the previous one, which means more traders sell the asset.
The MFI indicator compares such flows and analyzes the strength of the current trend.
MFI signals
So, what signals can the indicator make and what is the right way of their interpretation?
The indicator moves between 0 and 100. Its various readings show different market conditions.
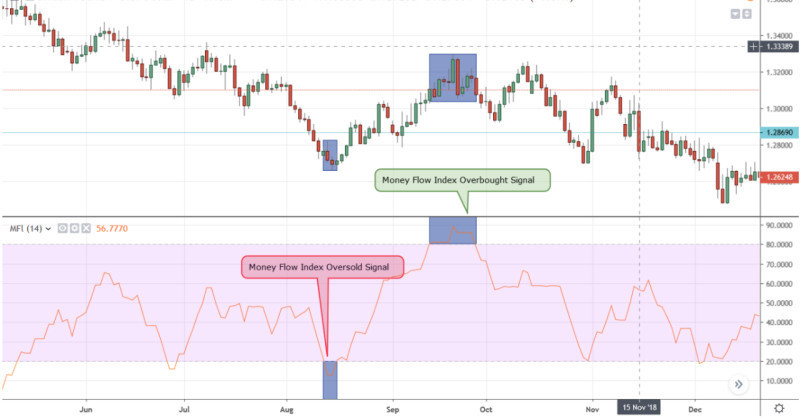
An MFI reading below 20 is considered oversold, while an MFI reading above 80 is considered overbought.
Moving between 1 and 20, the indicator generates a buy signal, reflecting a small trading volume.
When traders start to open more trades, the price of an asset begins to grow towards its high.
Moving between 80 and 100, the MFI signals it is time to close buy trades due to a steep rise in price.
Thus, the price starts to decline towards its low.
A sell signal is generated when the MFI is above 80 and then crosses back below the level. When the indicator is below 20 and crosses back above the mark, a buy signal is made.
Level 50 can also be used as a signal. So, when the indicator goes below 50, a buy signal is generated and when it goes above 50, a sell signal is produced.
Setting up MFI
The indicator is commonly used on popular trading platforms.
As we know, the MFI is not plotted on the price chart but is shown in a separate window below it.
A trader should customize the indicator’s settings properly in order to trade efficiently. In the settings menu, you can select the shape, width, and color of MFI.
The indicator has default settings: the last 14 candlesticks are analyzed on a scale from 0 to 100, with 20 and 80 being considered the most significant levels.
Default settings can change. For example, you can choose a different period or level.
At the same time, it is important to remember that when the upper limit is set above 80, the indicator gets less sensitive to price changes and gives fewer signals. In other words, important signals can be missed.
When the upper limit is below 80, the indicator gets more sensitive and starts to generate a lot of signals. Many such signals may turn out to be false.
Therefore, default settings should be applied, and the indicator will make the right number of signals, according to savvy traders.
The MFI chart should also reflect level 50, as it can generate signals when the MFI crosses the mark in one direction or another.
MFI strategy
It is also important to compare the MFI chart with the price chart.
When the price and the indicator are moving up, it reflects an uptrend, which is about to continue for some time.
Conversely, when the price and the indicator are moving down, it shows that a downtrend will extend for a while.
When the indicator is moving up, and the price is falling, it signals a reversal. This is the moment to look for entry points.
When the indicator is moving down, and the price is rising, there is usually a so-called false trend. This is when major players increase the price of an asset for others to buy.
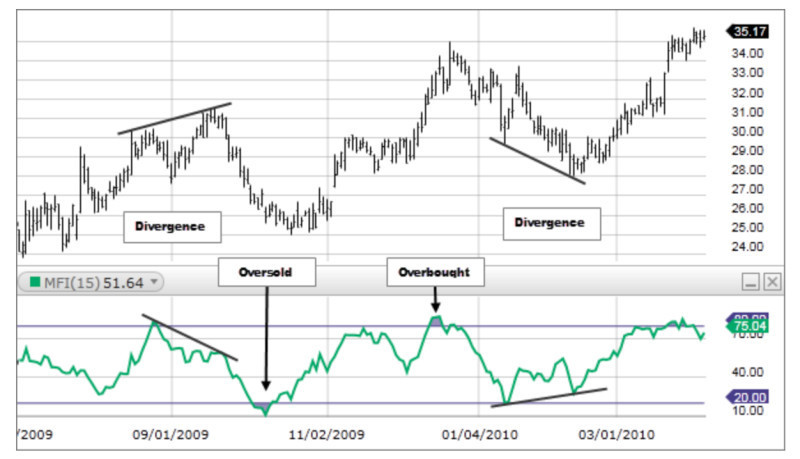
When there is a divergence between the price chart and the MFI chart, this is the signal to open a trade.
Divergences happen when the MFI and the price disagree with each other. They can either cross or diverge.
Sometimes, the price can hit new highs, while the MFI is moving down.
This is a bearish divergence, which should be interpreted as a signal to sell an asset.
Conversely, when the price reaches new lows, and the MFI is moving up, there is a bullish divergence. This is a signal to buy an asset.
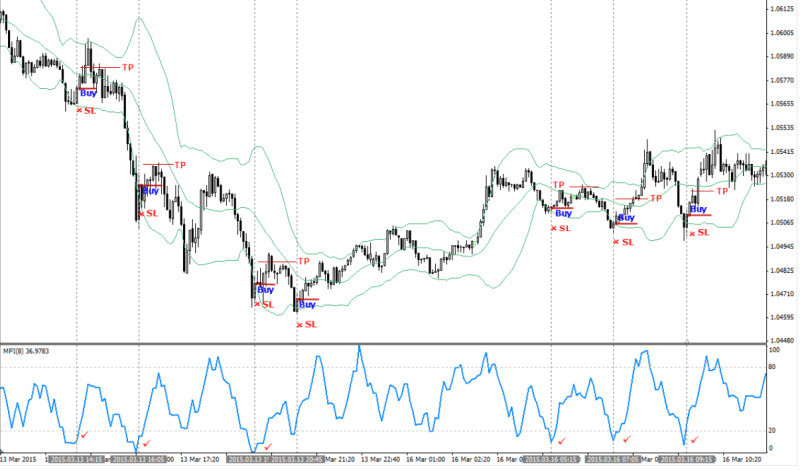
Other indicators can also be applied. For example, Bollinger Bands show the direction of a trend and detect market volatility.
Entry points can also be found with the help of patterns on the price chart and the MFI chart. They are usually formed on both charts at once but are easier to find on the price chart.
When similar patterns are found on both charts, you can consider buying or selling an asset depending on what the pattern shows you.
Owing to the high sensitivity of this indicator, it can be used in short-term strategies.
Advantages and disadvantages
Each indicator has its pros and cons, and the MFI is no exception. Here are its advantages:
- Universality. The indicator can be used for trading any assets in any market and in any time frame.
- Self-sufficiency. The indicator is good on its own, you can develop an efficient trading strategy using just MFI. However, some traders still prefer combining it with other indicators although it is unnecessary.
- Volume indicator. The indicator takes into account not only price changes, but also trading volumes, thus giving more accurate signals.
- High sensitivity. When prices change, the MFI reacts faster than any other indicator, which tends to lag. This allows traders to receive more up-to-date information and signals.
- It helps identify reversal points. The MFI crossover of levels 80 and 20 identifies a reversal.
As for disadvantages, they are the following:
- False signals. The indicator can generate a lot of false signals. However, this usually happens due to incorrect settings, i.e. the upper limit is set below 80.
- A time frame is not specified in the MFI settings. You can choose a time frame only through trial and error.
Difference between MFI and RSI
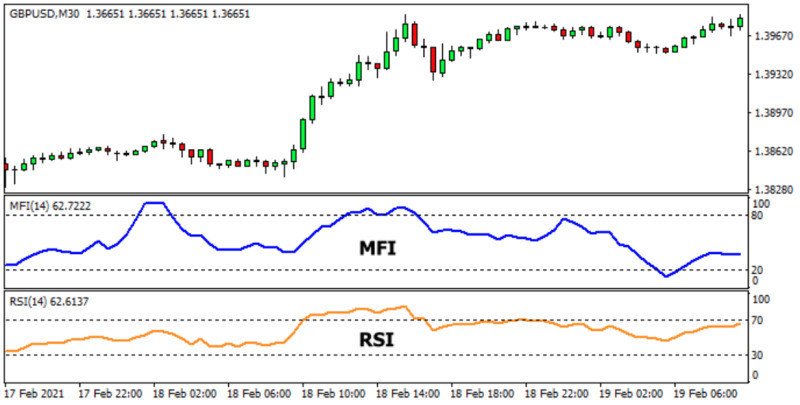
The MFI is oftentimes compared to the RSI. Indeed, they are very closely related but also have their differences.
They are similar because their charts are drawn separately from the price chart. Both indicators move between 0 and 100.
Their main difference is that the MFI is a volume indicator, and the RSI is an oscillator indicator.
Although the MFI is less popular than the RSI, it has a bigger advantage because it measures not only price changes but also the money flow strength by calculating trading volumes.
Above else, the so-called base levels or default settings for the RSI are 30 (lower limit) and 70 (upper limit), while for MFI, they are 20 (lower limit) and 80 (upper limit).
This does not mean that these indicators can’t be configured differently and used with other values. Still, the indicators make the most correct signals when used with default settings.
At the same time, both tools should be combined with other indicators, for example, trend indicators, to confirm and filter their signals.
In addition, patterns formed on the MFI and RSI charts can confirm and sometimes be ahead of the patterns on the price chart.
Finally, the last 14 bars should be used to analyze both the RSI and MFI.
Rules and secrets of using MFI
Following certain rules, the MFI can be very efficient.
1. Use default MFI settings with period 14 and levels 20 and 80, especially when it is applied to your trading strategy for the first time:
2. Monitor MFI: when it moves above 80, an asset is overbought, which means you can sell it. Conversely, when the MFI moves below 20, an asset is oversold, so you can buy it.
3. In addition, it is important to monitor how the indicator moves around 50: when it crosses the level and goes up, the price rises, which means you can buy. At the same time, when it goes below 50, the price falls, and an asset can be sold.
4. In other words, there is no need to wait for the price to reach the low or the high, and you can open trades at the moment the indicator crosses 50.
5. The indicator should be one of the elements of a trading strategy, but not the only one. To confirm and filter MFI signals, as well as to get a clearer picture of the market, you should use other tools, such as trend or channel indicators.
6. Pay attention to divergences between the price chart and the MFI chart as they indicate bullish and bearish pressure. A bearish divergence is considered a signal to sell, while a bullish divergence is a signal to buy.
7. Patterns can also help you find entry points when they are in line with the price chart and the MFI chart.
8. In spite of the RSI’s greater popularity, the MFI can be more effective because it also calculates volumes.
9. Test the indicator on the quote history or a demo account before proceeding with live trading.
10. If the indicator generates too many signals, you should change its settings: set the lower limit at 10 instead of 20, and the upper one at 90 instead of 80. There will be fewer signals made, so you can trade comfortably.
11. Alternatively, if you want the indicator to produce more signals, set the lower limit at 30, and the upper one at 70. In such a case, you should be prepared for false signals.
Final thoughts
This article is about the MFI indicator. With its help, you can analyze various markets.
It should be used with default settings as this is the way to receive more accurate signals.
The strongest buy signal is made when the indicator goes through 20 and a sell signal is produced when the MFI passes 80.
Other technical tools, like trend and channel indicators, should also be used to confirm MFI signals.
When patterns on the MFI and price charts are in line, they can generate strong entry points as well.
The MFI is often compared to the RSI oscillator. Indeed, they are very closely related. Still, the MFI is more efficient although less popular.
Read more
Bollinger Bands: strategy and way of use
Awesome Oscillator: how to use
Support and Resistance Indicator MT4, MT5
VWAP Indicator (Volume Weighted Average Price)
MT4 indicators: how to install and use
Candlestick patterns Indicator for MT4, MT5
Forex volume indicators for MT4, MT5
Forex arrow indicators for MT4


