


If you have decided to start trading on Forex but do not know how to begin, read the article "Forex indicators". The article is devoted to the tools that may facilitate trading and make it more profitable.
Today, we are going to focus on the indicators of the support and resistance levels. You can learn how to use the indicators, what strategies to apply, and what role they play in trading.
Indicators’ role in trading
Although there is a big variety of indicators, tools that refer to the Support and Resistance group are the most popular ones. The fact is that they are easy to use, minimize trading risks, and help traders to choose the best entry points.
The vast majority of traders use these indicators. That is why trading with such algorithms has become a classic on Forex. Traders even joke that trading without pivot zones is the same as driving with your eyes closed.
While some traders create their own strategies based on these indicators, others apply them as an additional tool. In any case, support and resistance levels are the main components of any market, including currency, stock, and some others.
Experienced traders are able to determine support and resistance levels using their own knowledge and intuition. However, they still need ready-made algorithms.
For most beginning traders these algorithms are almost the only way to find the pivot zones on the chart. Without sufficient experience, traders can make a mistake and take an incorrect trading decision.
On Forex, such mistakes inevitably lead to financial losses.
We have already discussed the importance of the support and resistance levels in trading. Now, let us find out what these levels represent.
If we follow the price movement of any currency pair on a chart, we may see that the price is constantly changing. It moves up and then drops. It is a constant process.
However, sometimes, the price changes faster and sometimes slower.
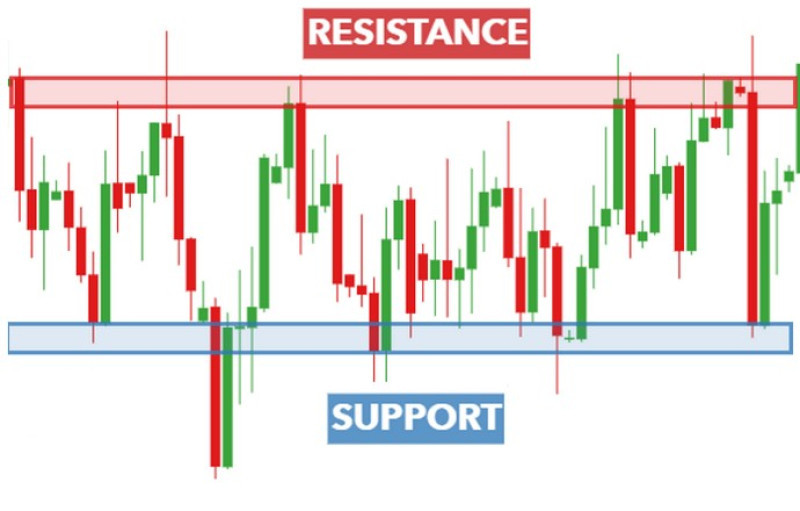
At first sight, all the changes seem chaotic, but, in fact, there is a particular order. When the price rises, it often reaches a particular limit, which it cannot break. As a result, it has to decline.
If the price tests this limit more than once, this level is considered resistance. It is a particular barrier that prevents the price from a further rise.
At the same time, a support level does not allow a currency pair to drop below a particular value. If the price touches the level and rebounds from it, it means that this level is acting as support.
The more the pair rebounds or bounces off these barriers, the stronger they are.
In the first case, the barrier is formed by means of horizontal lines, which connect the highest prices. In the case of support, horizontal lines connect the lowest level. These are extreme points. There should be at least two extremes.
Why do such barriers appear on the forex market?
Trading on any market, whether it is currency, stock, or a crypto market, is the opposition and interaction of two categories of traders – buyers and sellers. The first ones are called bulls and they earn when the price rises. The second category consists of bears who make a profit from the price depreciation.
Their constant opposition forms demand and supply. Bulls are responsible for demand, and bears – for supply.
If the price falls, thus approaching the support level, it means that sellers are controlling the market. However, the price will inevitably run into opposition from buyers who want to buy the asset at the lowest possible price.
When bulls enter the market, this prevents prices from a further decline.
The price movement towards the resistance level points to bullish activity. However, when bulls start losing momentum, sellers immediately begin preventing the price from a further increase.
In other words, once the price touches any pivot level, its future behavior depends on those traders who show higher activity, namely bulls or bears.
In such cases, the market situation changes for the opposite very often . However, sometimes, a breakout occurs. As a result, resistance turns into support and vice versa.
However, the way support and resistance work depends on a particular market situation.
They are really effective when trading activity is increased. For example, such situations take place amid high volatility caused by important economic events.
In case of a sideways movement, traders should be very cautious when opening positions relying on support and resistance. To make trading safer, it is better to take into account an area around the pivot level and not a particular reading.
Let us take a look at an example from real life to explain how demand and supply are formed on Forex. Let us say Christmas is approaching and people are actively buying fir trees.
If in a city, there is only one outlet selling these trees in a certain district, there will be more buyers there than in the district, where there are several outlets. Sellers can raise the price of their goods since demand exceeds supply.
And vice versa: if there are a lot of stores, they can lower the cost in a struggle for customers. In this case, supply is greater than demand.
How to trade
To clearly understand what pivot zones are, traders do not have to determine them by themselves. However, this could become a useful trading skill.
Nevertheless, traders usually resort to ready-made indicators. They are algorithms that fix support and resistance zones on the chart very accurately.
What is more, the determination of pivot levels by yourself could be affected by a personal point of view. Meanwhile, indicators exclude this factor.
There are a lot of tools that help traders to identify pivot levels. However, they differ by calculation methods and settings as well as visually. However, the aim is always the same – to find resistance and support zones.
Peculiarities of such algorithms:
· traders do not receive signals since there are no entry points on charts. Traders should analyze the received data and decide when to open or close a position;
· the strength of a pivot zone depends on a time frame: the bigger a time frame is, the stronger a pivot zone becomes. However, on big time frames, it is less possible to determine an accurate zone;
· the number of extreme points also affects the strength of a pivot zone: the more points we see, the stronger the zone is;
· they help to settle a Stop Loss order in the right place;
· they could be used with any trading strategy;
· they could be applied when trading on a demo account;
· they help to determine a price direction;
· they allow traders to evaluate risks and predict income.
Although there is a big variety of such indicators when trading it will be better to follow some principles:
1. It is better to go long when the price hits a support level;
2. Sell orders could be initiated if the price touches a resistance level;
3. The pair should not necessarily touch pivot levels. Traders may enter the market if the price approaches a pivot level and it needs just 1-7 pips to touch it;
4. A Stop Loss order should be placed below the support level when buying and above the resistance level when selling.
When using these algorithms traders should keep in mind an important fact. If the price touches a pivot level, the market situation may develop according to three scenarios:
· the price may bounce off the level and change its direction. It happens when the pivot level is very strong;
· the price breaks the pivot level and continues moving in the same direction;
· the price shows a false breakout. In other words, it breaks the pivot level for a short period of time and then changes its direction.
The above-mentioned principles of trading are typical for the first scenario when trading is based on a rebound (bounce). It is the most popular strategy on Forex.
Two other scenarios presuppose other rules. We will tackle the issue a bit later.
In general, traders who use support and resistance levels choose one of the following strategies:
1. Aggressive, when positions are opened just after a breakout or a rebound;
2. Classical, when orders are initiated only when a signal is proved on the following candlestick.
An aggressive approach may bring significant income. However, risks are also very high. That is why most traders choose a classical strategy.
Support and resistance indicators: MT4 (levels)
The indicator of support and resistance levels is the most popular level algorithm compatible with MetaTrader 4. It fixes the nearest pivot levels on a chart.
Main advantages of this indicator:
· could be used on any time frame. However, some traders suppose that the best time frames vary from 15 minutes to 1 hour;
· could be used on both Forex and stock exchanges;
· does not alter a chart in an attempt to adapt it to the market changes;
· has intuitive settings;
· does not cost anything;
· does not overload a chart;
· could be intuitively managed.
Disadvantages of the indicator:
· like other algorithms of this type, it does not provide signals to open and close trades, and does not guarantee income;
· does not notify users about changes in the market. If traders are distracted, they may miss the right moment to enter the market because the indicator does not have a built-in alert.
The instrument was created on the basis of the Fractals indicator of Bill Williams' Trading System, which is automatically included in MetaTrader. Its principle is based on the search for the tops and lows of a quote.
At the same time, the Support and Resistance indicator searches for zones with fractals, which it uses to build levels. On the chart, they are presented in rectangles of two colors.
Blue rectangles stay for support, whereas pink and orange ones are for resistance.
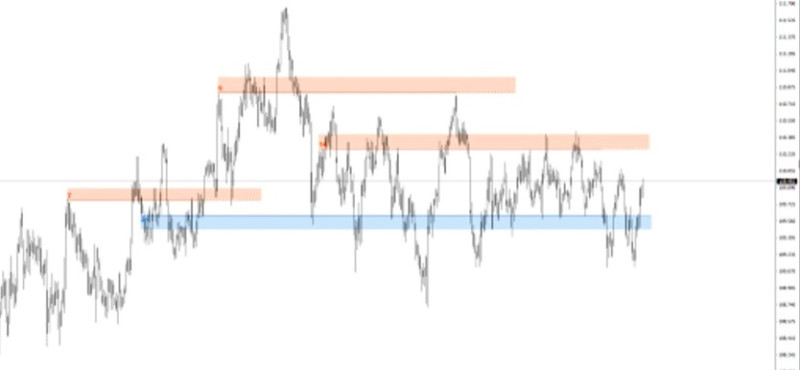
Some traders may have a question – why does the indicator use rectangles instead of lines? The fact is that the indicator determines a channel of prices. Usually, a price often interacts with a particular area and not with a particular level.
This helps traders to analyze the market situation and understand in which range the price may show a rebound or a breakout. In addition, these areas may widen with the appearance of new extremes.
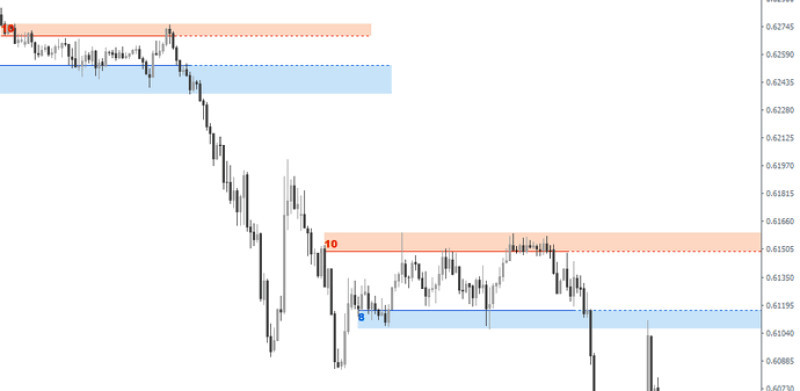
The indicator builds rectangles using the biggest number of intersections of a particular level by the price. The more times the price touches the level, the stronger it becomes.
The number of touches is specified in the lower left corner of each rectangle. By clicking on the number, traders may see where the price touched the pivot level. Thus, traders receive a more accurate picture that reflects the price movement.
Sometimes the places where the price touches pivot levels are located beyond rectangles. The aim is to create the most accurate areas and channels.
What is the main advantage of the indicator compared with the situation when traders build the necessary lines and channels by themselves?
Firstly, the indicator does this faster than traders, preventing them from wasting time in the search of the highest and lowest prices. It is better to use the indicator directly for trading.
Secondly, traders receive detailed information about how many times the price approaches extremes. This allows them to evaluate the strength of a particular zone. When using a manual approach, traders should calculate this number of touches and only then apply it for trading.
Apart from performing its key task, building levels, this algorithm also facilitates trading, by saving traders’ strength and time.
The indicator also suits novice traders, who lack experience in indicating pivot levels. Professional traders can also apply the indicator to save time and resources.
Strategies
Support and resistance are the main concepts of the forex market. A lot of strategies were created on their basis. They are highly effective and rather easy to use.
Some traders strictly follow just one strategy, while others use one strategy after another depending on the market situation.
Let us look at these strategies in detail.
A breakout strategy presupposes the intersection between the price and one of the pivot levels. In this case, traders should do the following:
Indicate a trend: it is very important as in the case of a bullish trend, the quote will break a resistance level, while amid the bearish one, it will break a support level;
In the first case, traders should go long, in the second case – go short;
Place Stop Loss and Take Profit orders beyond resistance and support depending on the breakout direction;
Close positions when the price starts showing signs of a possible correction. It is crucial to do this as early as possible to avoid zero profit. Very often, a price returns to the level recorded at the moment of entering the market;
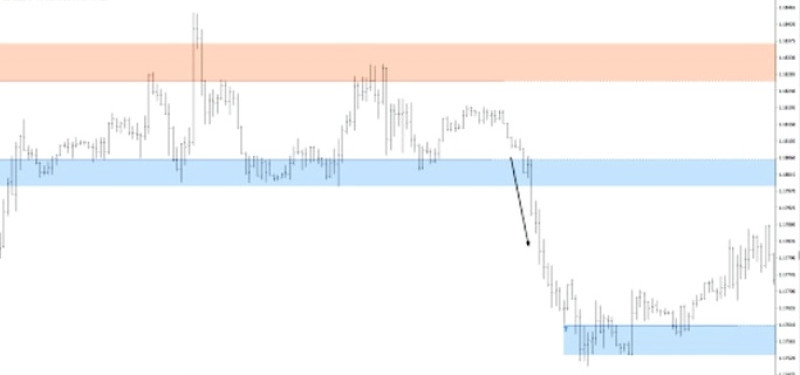
On the chart below, we see that the price of the euro/dollar pair is dropping, thus proving a negative dynamic. At a particular moment, it crosses the support level.
Under the current conditions, it will be better to open short positions when the price closes below the pivot level.
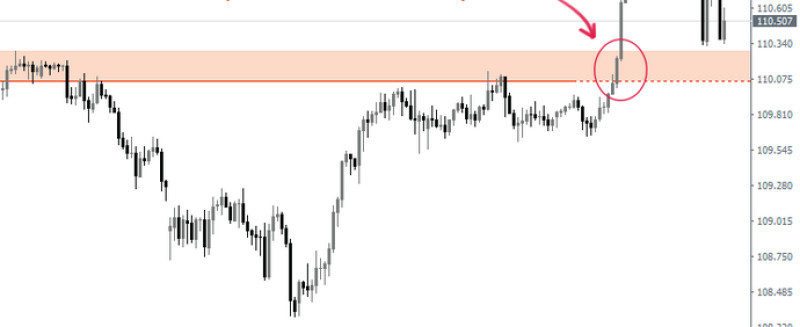
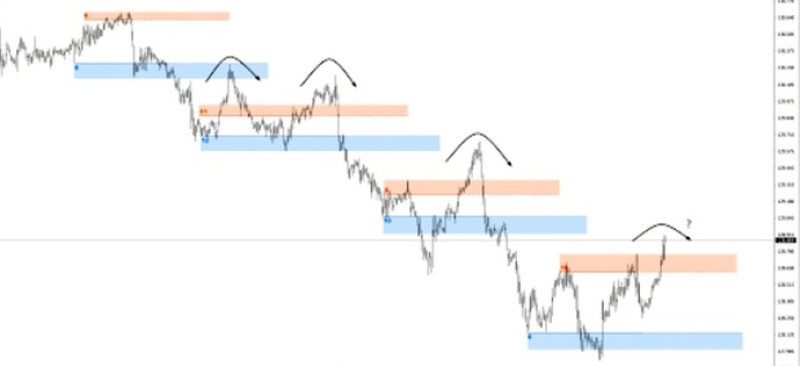
On the next chart, the dollar/yen pair crosses the resistance level. We will see a real breakout if the price closes below the resistance level.
Once traders notice this, they should immediately open a long position.
The pivot advantage of the strategy is that traders who choose it have the lowest possible opportunity to open an unsuccessful trade. However, a false breakout may occur.
To be on the safe side, traders should pay attention to other signals or wait until the price proves the breakout. In the second case, a candlestick should close below the broken support level or above the broken resistance level.
When using the strategy, traders should also remember about a Stop Loss order. It is necessary to settle it below resistance and above support, depending on the zone the price is likely to break.
To determine the place of the stop order, traders may rely on the average asset volatility. Practice shows that it is a reliable method.
The use of a Trailing Stop order is one more way to limit losses. In this case, a position will automatically close when a correction begins.
Thus, traders will surely make a profit without wasting time on chart analysis. However, traders should remember that the profit is also limited.
Why so? If the correction is insignificant, the price begins moving in the previous direction.
That is why it is impossible to earn money since Trailing Stop executes and closes the trade.
Test and retest. We have already mentioned that when the price hits one of the pivot levels, the situation may develop in different ways.
For example, the price may break the level or it may rebound and change its direction. A test and retest act as filters. However, most traders do not distinguish between these two concepts.
Both test and retest are effective amid a particular dynamic.
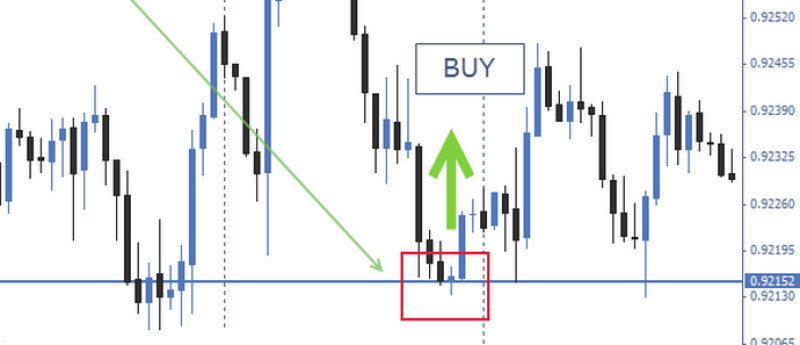
The fact is that traders do not open a position just after the price crosses a pivot level. They wait until the price alters its direction, tests a support or resistance level, and then begins moving in the previous direction.
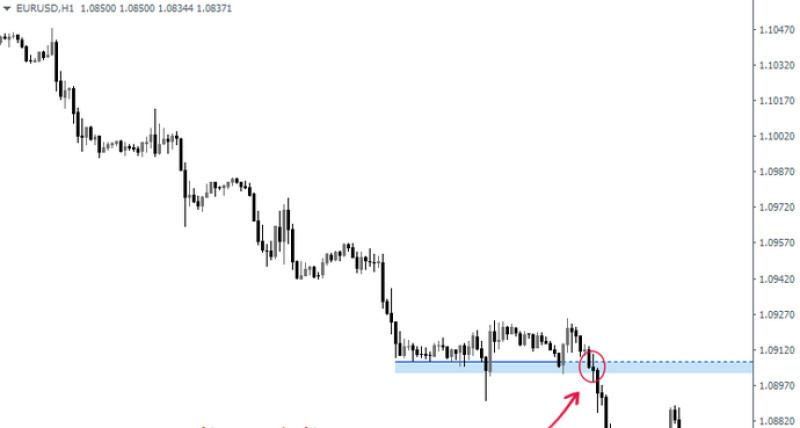
On the chart, we see that the euro/dollar crosses a support level. After that, the price reverses without breaking the level, rebounds from it, and starts falling.
At that moment, support turns into resistance.
It is a perfect moment to go short.
Oftentimes, the price approaches pivot levels several times, providing a good chance to open a position.
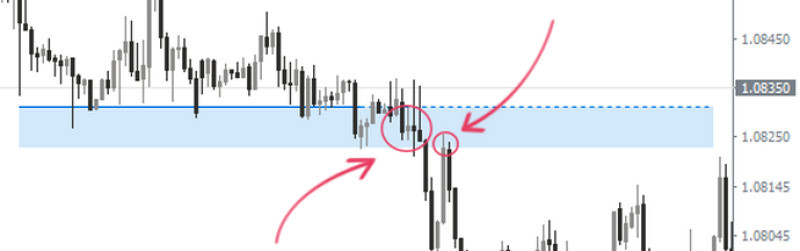
On the screenshot, we also see an example of how the price retests the resistance level. Firstly, the price rises, approaches the level, and then breaks it.
After that, the price alters its direction, approaches the pivot level once again, and rebounds. If it does this at least twice, traders may open long positions.
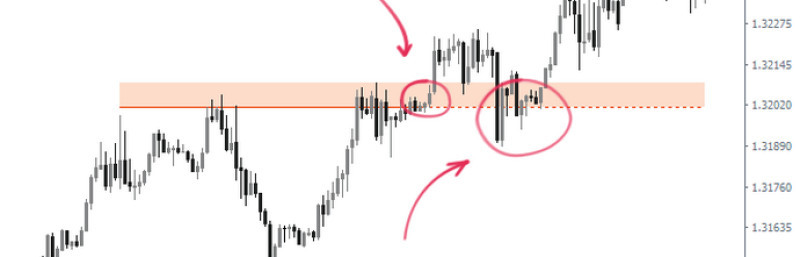
While the retest strategy presupposes a test after a second breakout, the test strategy is based on a test after the first breakout.
On the screenshot, we see a test after a rebound.
Some traders may have a question about what strategy they should use. It is impossible to say which of two strategies is better.
The first one presupposes more risks.
However, the application of the second strategy increases the likelihood of losing a possible income. The fact is that quotes may not return to the pivot zone. It means that traders will not receive a signal to enter the market.
1. In case of a rebound, traders may go long after the price hits support, and go short after the price touches resistance. They bet on the price reversal after it reaches a pivot zone.
This is the most frequent scenario especially in the event of strong pivot levels.
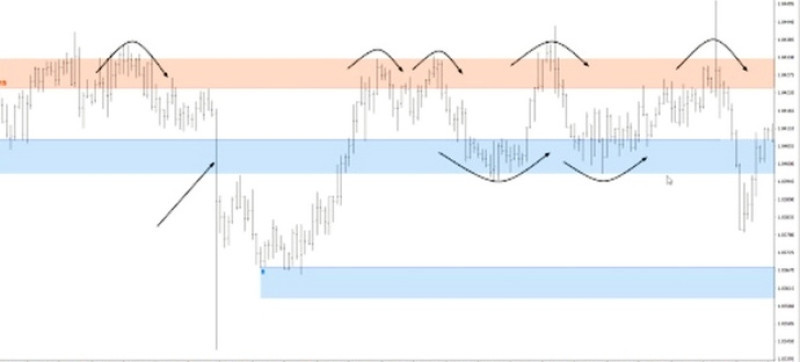
1. A rebound in the horizontal channel. This approach could be used if quotes are moving between pivot levels. From time to time, the price touches one level after another without leaving the channel.
In this situation, traders should sell when the price touches the upper limit and buy when it touches the lower one. However, if the price is in the pivot zone, it will be wise to avoid trading.
A rebound is the most suitable period to open positions.
The area between the pivot zone is usually divided into several additional channels. Long orders could be initiated when the price is in the closest position to the support channel. Short orders should be opened when the price hovers in the channel closest to the resistance level.
As a rule, traders do not enter the market when the price is in the central channel.
To choose the most suitable strategy, it is better to test each of them on a demo account or open trades of small size.
Notably, when applying a rebound strategy, traders should place a stop order before the pivot level. When using a breakout strategy, it is better to settle a stop order after the pivot level.
Settings
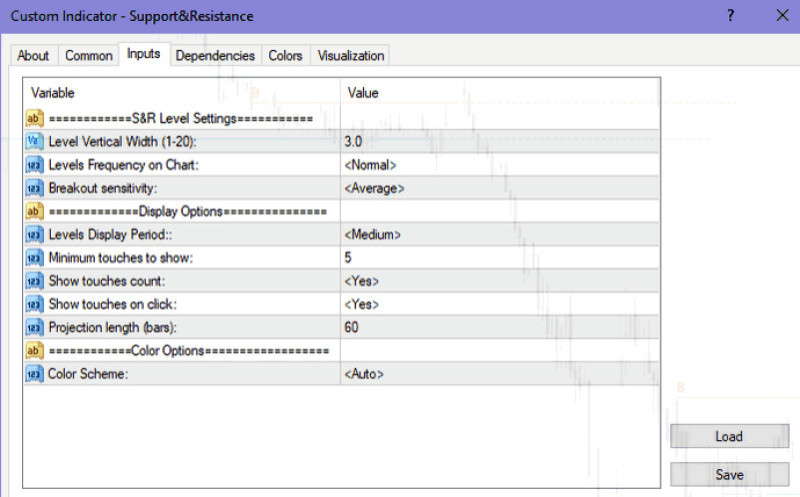
Before starting to use the indicator of support and resistance levels, it is necessary to make some settings. Let us focus on the main blocks.
2. Levels. This block is responsible for the visual display of pivot zones on the chart:
· Level Vertical Width: Here traders should specify the width of the areas by selecting a number from 1 to 20. If they choose 1, the width will be the minimum, if 20 – the maximum and will unite a larger price channel;
· Levels Frequency on chart: this indicator is responsible for the density of the zone placement in each specific case. The higher it is, the more images will appear.
It could be of big, small, and normal size.
Breakout sensitivity: The value of this indicator determines the sensitivity to a breakout. That is, the number of fractals required for the level to be considered broken is taken for calculation;
2. Display Options. This block indicates features of pivot zones.
Levels Display Period displays the quotes’ history, which is used to build zones. In other words, it displays the number of candlesticks and bars.
The indicator could be short (300 candlesticks), medium (600), and long (1,200).
Minimum touches to show: there traders can see the smallest number of fractals, which is used to display pivot levels;
Show touches count: in this line, traders can switch on/off the appearance of numbers on a chart. Notably, these numbers show how many times quotes touch pivot zones;
Show touches on click: when this option is activated, traders may click the number of touches to learn where quotes touch pivot zones. It is an important function when analyzing the quotes history;
Projection length: this indicator points to a horizontal length of the built areas.
3. Color Options: this block is responsible for the colors of the indicator. Traders may select the color of the background or rectangle, etc.
Support and resistance indicators: MT5 (levels)
There is a great variety of modifications to the Support and Resistance indicator. Thus, there is an algorithm adopted for the MT5 trading platform.
In this case, pivot zones are fixed in the form of horizontal lines built from points. If the line is green, it is resistance. If the line is purple, it is support. However, there could be variants, including red and blue colors.
If we speak about resistance, a line connects local highs. In case of support, it connects local lows. The method is based on the fractals we have already talked about.
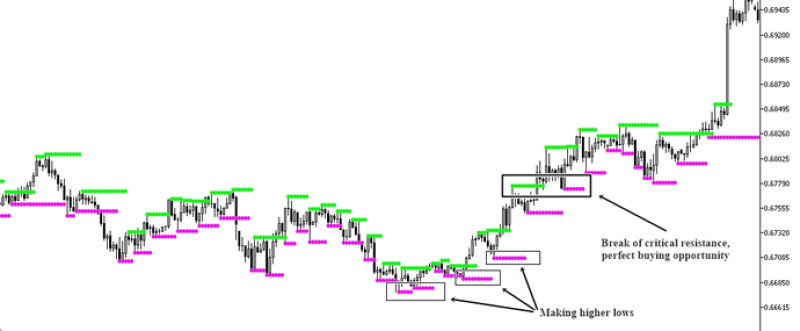
The availability of many currencies is the main advantage of this algorithm (traders can work with various currency pairs). In addition, traders may choose any time frame they want.
Using this algorithm traders should keep in mind general principles of trading from pivot levels.
For example, if it is a breakout strategy, long positions could be opened if the price upwardly crosses a green line. Traders can go short if the price downwardly crosses a purple line.
If traders prefer a rebound strategy, buy orders are initiated when the price touches a purple line, whereas sell orders are opened when the price touches a green line.
According to the first strategy, the price should follow its direction after it intersects the pivot level. The second strategy presupposes the price reversal after the intersection.
The Support and Resistance indicator for MT5 helps traders to set a Stop Loss order.The principles of the order settlement are the same for both MT4 and MT5 platforms.
To start using the tool, traders should download it. Then, they should follow the steps described below.
How to install
The indicators we focus on in this article cannot be found among the standard algorithms for MT4 and MT5. This does mean that the tools of this group are not available for these trading platforms.
The pivot levels could also be indicated by the following tools:
· Fibonacci levels: they help to indicate strong pivot levels amid a clear trend and a possible correction. The tool could be used on various time frames.
· Various MAs: they are mainly applied on big time frames.
· Price channels: they have a form of price channels limited by two lines.
To use the Support and Resistance indicator, traders should add it to MT4 and MT5 by themselves. If it is the first trading experience, it is necessary to choose a brokerage company, open a live account, and download the trading platform.
After that, traders should add a new algorithm to the trading platform. Let us look at the step-by-step instruction:
Step 1: Launch a trading platform and select File;
Step 2: Go to the data catalog. Choose MQL and go to the Indicators section;
Step 3: Copy the indicator downloaded to the device. Insert into the Indicators fold.
Step 4: Update or restart the trading platform.
Notably, once all the steps are completed, traders should add the indicator to the chart, allowing the import of DLL.
To add the indicator to the chart, choose one of the following options:
Via the main menu of MT4 and MT5. To do so, go to the Insert section and select the needed algorithm;
Via the tools panel. In the Charts section click the + button;
Via Navigator. There, traders may either add or drag the indicator to the chart.
However, traders should keep in mind that the Support and Resistance indicator is not the only level algorithm for MT4 and MT5.
There are several tools aimed at finding pivot levels. Sometimes they even have similar names. Traders can learn more about them by means of links available in open sources or visiting MetaTrader Market.
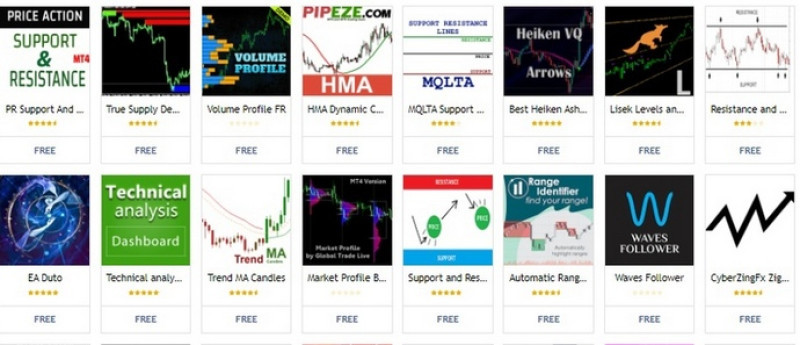
In any case, the installation process will be similar to the one we described earlier. However, some tools could be downloaded only for money and could be quite pricey.
Preparations
Before starting to trade with the help of the indicator described in the article, it is not enough to download and add it to the chart, especially if there are several variants of such indicators.
In this case, traders should do the following to understand whether the instrument suits them or not.
A test. It will be wise to open a demo account and test the Support and Resistance indicator. This will help traders to learn the features of the algorithm and understand the essence of the levels;
An analysis, which presupposes that traders should analyze their trading results. The fact is that it is necessary to find out the reasons for unsuccessful and profitable trades.
Live trading, when traders use real money instead of virtual. It is better to start with a cent account to minimize potential risks;
Integration in a trading plan. If traders have successfully completed all the previous stages, and the chosen tool proved its efficiency, it could be included in a trading plan.
To make the right decision, traders should answer the following questions:
· Do you understand the indicator’s principle?
· How does the efficiency of trading change with and without this indicator?
· How does it interact with other algorithms and what combination is the most reasonable?
· How often are you planning to use the indicator? What market conditions do you need to apply the indicator?
It is really risky to start using the Support and Resistance indicator on a live account. Traders are better to avoid big trading volumes, especially if they are just at the beginning of the trading career.
Rules of use
We have already mentioned that there are a lot of indicators that draw support and resistance levels. Traders should understand that the tool described in this article is just one of many variants.
For example, Andrews' Pitchfork and Bollinger Bands are very popular among traders.
Whatever tool traders choose, they should follow the main trading principles:
1. The bigger the time frame is, the clearer and more reliable the pivot level is. These factors will change together with the time frame;
2. After a breakout, a support level turns into resistance and vice versa;
3. The formation of a pivot zone is possible only if a line connects at least two extremes;
4. The most popular trading method presupposes sell orders from resistance and buy orders from support. Traders should close orders if the price reaches the opposite zone;
5. After a breakout, traders should wait for proof (a moment when support turns into resistance and vice versa) to enter the market;
6. Trading without a breakout proof is an aggressive approach, which may lead to serious risks;
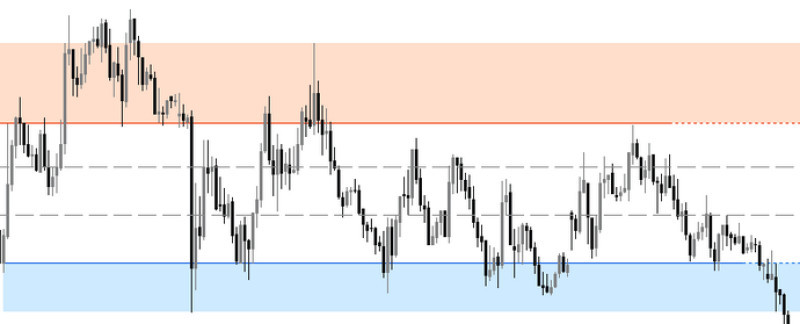
7. In case of a classiс approach, a Stop Loss order is placed under support for long positions and above resistance for short orders. On the screenshot, we can see an example of placing a Stop Loss order for a breakout.
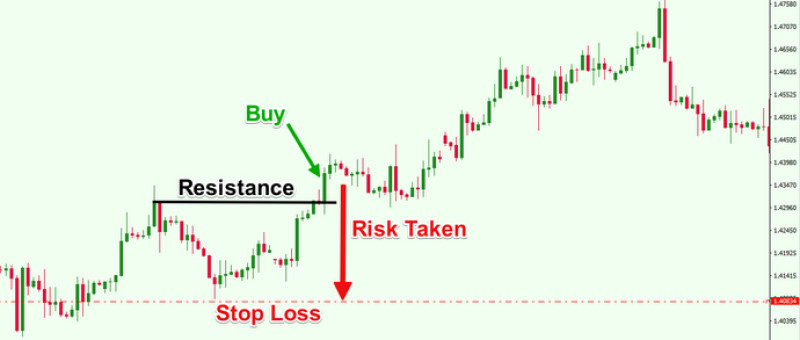
Notably, obeying these rules does not guarantee big profits but it prevents significant losses.
As a rule, when using support and resistance levels, traders face problems due to the below-mentioned reasons:
- Support and resistance levels are determined incorrectly. This happens when traders try to find pivot levels by themselves;
- pivot levels are used independently to predict a quote’s dynamic. Traders should know that such indicators do not provide signals of the price actions after it touches the pivot level.
The price may either rebound or continue its movement. That is why when traders apply only these instruments to make a trading decision, they face significant risks.
Conclusion
It is difficult to overestimate the role of the pivot levels in the forex market. Meanwhile, the indicator that automates the drawing of these levels has proven its effectiveness for many years of use.
It helps traders to spend less time on the analysis of the market situation and on the determination of good entry points.
However, traders should remember that Forex is unpredictable. Quite often, there are such situations when strong pivot zones disappear in several seconds.
How to protect yourself in such cases? Do not rely on the signals provided by only a particular algorithm.
It will be wise to add several tools to your trading plan, keeping in mind fundamental factors, which significantly affect quotes’ dynamic.
Read more
Bollinger Bands: strategy and way of use
MFI Indicator (Money Flow Index): complete guide
Awesome Oscillator: how to use
VWAP Indicator (Volume Weighted Average Price)
MT4 indicators: how to install and use
Candlestick patterns Indicator for MT4, MT5
Forex volume indicators for MT4, MT5
Forex arrow indicators for MT4


