


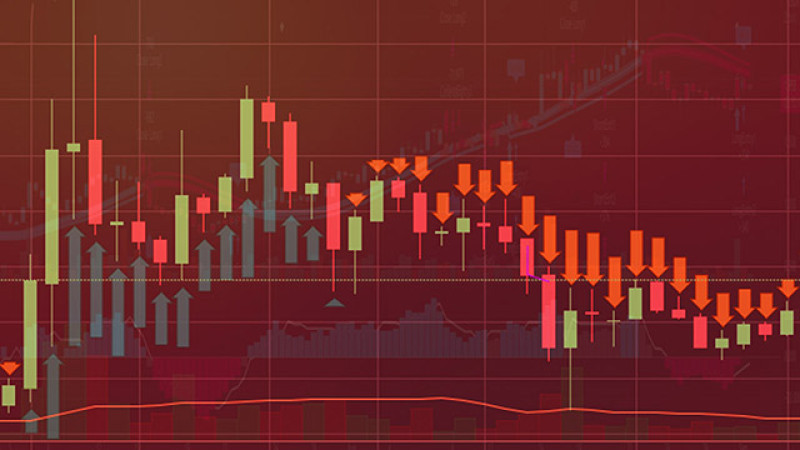
Forex arrow indicators without redrawing enable traders to buy or sell an asset with the help of signal arrows. How to use it efficiently? To achieve good results in practice, one should start with studying the theory. That is why we suggest you read the article "Forex indicators" that will provide you with basic knowledge on technical analysis of the currency market.
Meanwhile, in this article we focus on arrow indicators. Read further to learn what is their purpose, how they work, and how they differ from other tools.
Key facts about Forex arrow indicators
Though Forex trading is becoming increasingly automated, many market participants still prefer trading on their own. By doing that, they both profit from trading and feel satisfaction with their own skills and abilities.
Indicators help traders reach new heights. They are the benchmarks in the Forex market that help to open deals correctly and in a timely manner and leave at the right moment with optimal profit.
Currently, the choice of various indicators is impressive indeed. There are many algorithms that have long been known and tested in practice, and also there are the latest author's developments.
To use such algorithms in forex trading, it is enough to spend a few minutes downloading and installing them. In old times, traders used to draw complex schemes for a search of signals, spending days, weeks, and even months while looking for patterns.
At the same time, it is important to understand that the availability and simplicity of current indicators does not mean that they lack fundamental components.
Any technical tool is based on complex mathematical calculations. However, now this task is solved not by a trader, but by special algorithms developed over many years.
Few traders bother to understand ins and outs of trading algorithms, as it is useless in most cases.
The result is what really matters. Forex indicators transform past quotes, process them using formulas and various techniques to forecast an asset price in the future.
Any trader aims to find a tool that would suit their trading style, strategy, and preferences. Simplicity is also an important criteria.
It is no coincidence that even the mention of technical analysis and the numerous charts confuses some traders, especially beginners.
Moreover, complicated algorithms can not only confuse market participants, beginners in particular, but also lead to an undesirable financial results. Therefore, simple algorithms solve these problems and make the trading process as comfortable as possible.
Many professionals believe that the simplest Forex technical algorithms are the arrows. Let's explain why.
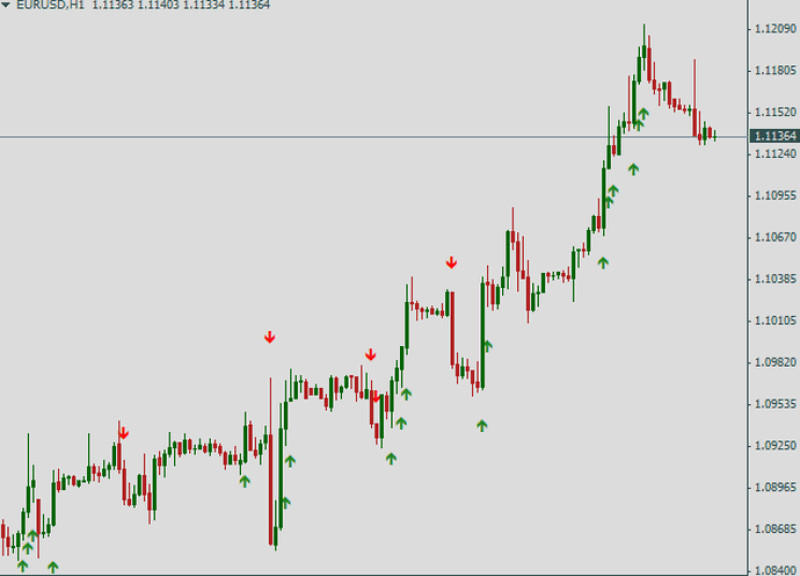
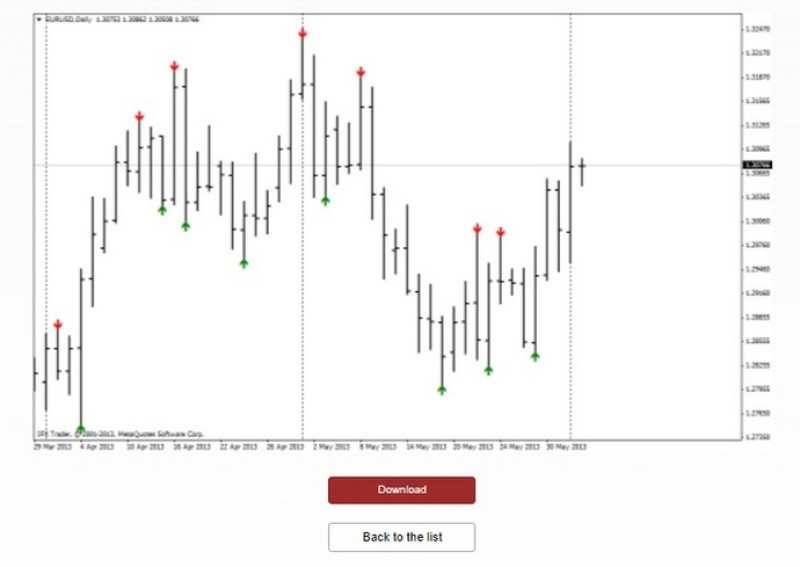
These algorithms give a clear answer to the question whether buy a currency or sell it at a particular moment. Graphically, it looks like arrows pointing up in the first case and down in the second.
The arrows are of different colors, which makes it easier to interpret them. By default, arrows are green and red for long and short positions, respectively.
Sometimes, the signals come with sound alerts. So, this is extremely simple and clear.
Such tools have been specially developed by experienced traders is collaboration with programmers in order to:
- ensure convenient trading process;
- provide visiual trading recommendations;
- achieve prompt reaction;
- release traders from from detailed study of trading signals.
There are simple and complex arror indicators. In the complex ones, one of indicators gives a corresponding signal, and the rest only pass it through the filters. As a result, a trader receives a recommendation as to when and in what direction to open a trade.
In MetaTrader4, different tools can be combined. In addition, they can be added on charts or placed in a separate window.
Most often, the arrows in discussion are placed above or below a candle or bar. Less commonly, they are applied near auxiliary straight lines or curves formed by the indicator.
Importantly, all arrow indicators look similar to each other. However, they differ by the specifics of obtaining the final data.
The thing is that such algorithms do not appear out of nowhere but are based on basic tools. These can be moving averages, the Relative Strength Index, Stochastic and other.
Arrows are just a result of transformation of quotes based on such basic tools.
Pros and Cons of arrow algorithms
As already mentioned, the main advantage of arrow indicators is their simplicity and ease of use. Forex traders do not need to spend time and effort while interpreting these indicators, because arrows show what action to take and when.
In addition, there are some more advantages of these technical analysis tools:
- Fast data processing. In this regard, the speed of a trader's actions is comparable to automated trading, because a user can instantly respond to signals and open positions;
- In most cases, these tools do not require redrawing. We will provide more details about it below, but for now we will only explain that this property makes arrow more stable;
- Objectivity. Unlike other tools, arrows eliminate the double interpretation of data. And this helps traders avoid wrong steps, which they may take due to inattention or little experience;
- Basic and clear settings for most users. However, this advantage can also be considered as a weak point, because it does not allow the algorithm to be adapted to any market conditions;
- The low probability of missing important signals. Trading is stressful, because quotes are constantly changing, and a trader needs to carefully monitor the situation on the market.
The risk of missing some signal is quite high for beginners or during news releases. But it is impossible to miss the arrows; - The lowest possible psychological and visual strain on traders as they do not need to track charts all the time and analyze price movements;
- Saving time on the analysis of charts of price changes;
- Suitable even for beginning traders who do not have rich experience and deep knowledge of Forex;
- Some variants come with recommended values of StopLoss and TakeProfit.
Despite all these advantages, arror indicators have their drawbacks. Notably, there are fewer cons than pros.
Drawbacks:
- Low efficiency when used alone. To confirm the signals, it is better to refer to other analysis tools as well;
- Lags that may affect the trading results. Lags arise due to constant and rapid changes in quotes, market noise or slow operation of a trading platform;
- Most of the arrow indicators are not suitable for scalping and are tuned for medium and long-term trading;
- The same tool cannot be equally efficient in flat market conditions and in the periods of increased market activity. That is, there are no universal options in this regard;
- In most cases, a trader sees only the result of calculations, presented in a form of arrows, and their details remain hidden. Because of this, a trader's technical analysis skills develop slowly or do not develop at all;
- Some of the arrow indicators require redrawing. In such a case, arrows can change colors, and consequently, point in different directions, which may cause negative trading results.
At the same time, an arrow indicator is not a must-have tool for successful forex trading. However, most popular trading strategies are based on these indicators.
The arrow indicators are simple, straightforward, and easy to use, so their advantages are obvious.
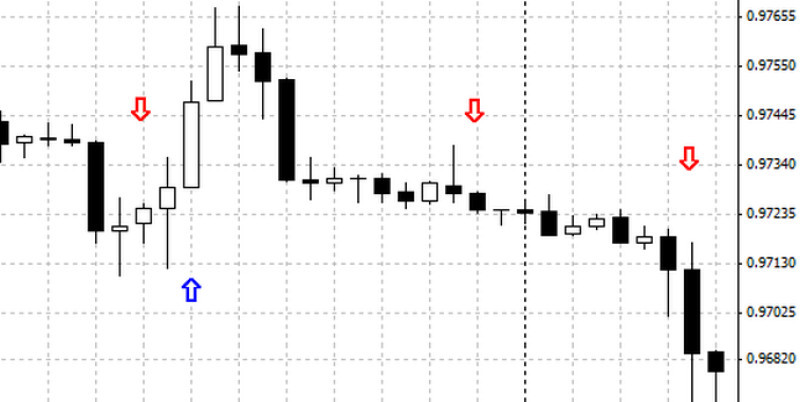
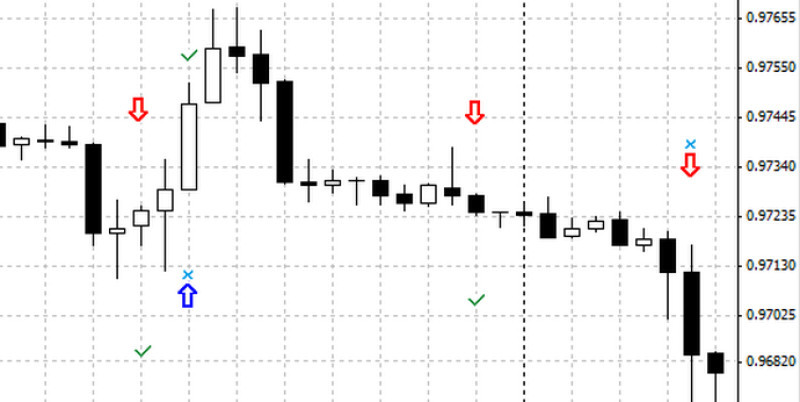
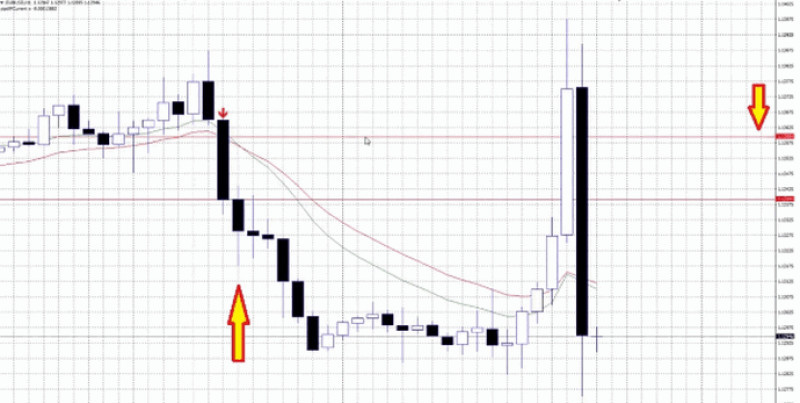
Forex arrow indicators without redrawing
This group of algorithms is considered most reliable by traders. And there is a logical explanation for this assumption.
To explain how this type of arrow indicators works, it would be easier to describe the opposite type of the indicators that require redrawing. Why are they criticized so often?
The fact is that indicators of this type may change the initial signals for entry points. And this is the way to financial losses for a Forex trader.
Suppose a trader reacted to a signal to buy a currency and opened a deal. But after some time, the market situation changed, and the algorithm adapted its data to it.
The initial signals disappeared, and a trader who planned to make a profit lost a part of their deposit.
The indicators without redrawing work quite the opposite. They do not change the initial signals to adapt them to market conditions. In other words, such indicators are stable.
Here are the key features of indicators without redrawing:
- it raises the probability of getting profits
- it provides unambiguous data
- it meets traders' expectations and enables them to avoid wrong decisions due to changing signals.
To use an arrow indicators, a trader needs to download and install it on a trading platform. It takes merely 10 minutes.
Let us provide details about some arrow indicators compatible with MetaTrader 4 as this platform is quite popular with forex traders.
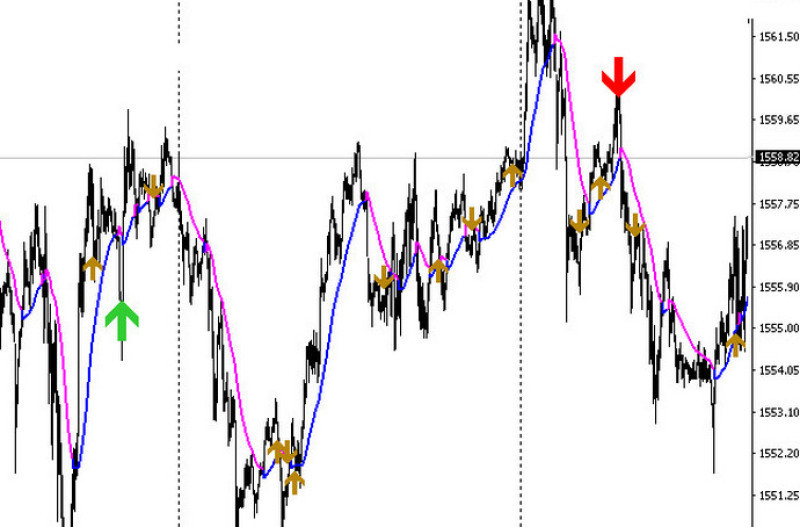
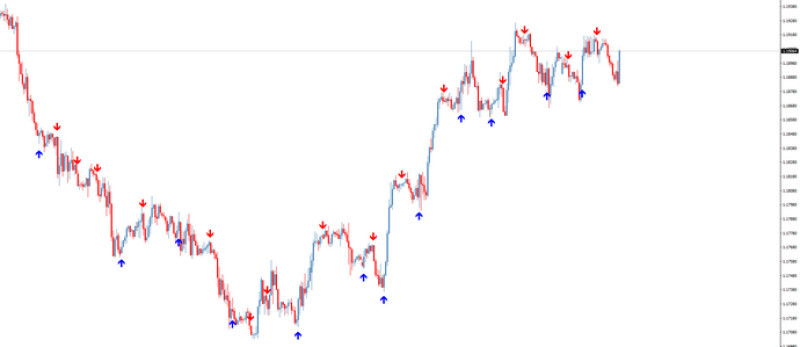
1. Trend Master is an algorithm based on several moving averages, all of which are combined into a single line. This line changes its color simultaneously with the change in the quotes movement.
The line is blue when the trend is upward, and its color is red when a trend is downward.
This indicator can be considered universal, because it can be used in different strategies using any timeframes, starting from M5.
Besides, there are no limits on the number of assets. That is, all available currency pairs can be traded with the use of this indicator.
Now let's focus on the arrow pointers. The red arrows directed downwards provide sell signals, forecasting that quotes will begin to decline in the future.
The green arrows pointed to the upside indicate a buying opportunity because they signal a probability of future growth.
In addition to them, there may also be arrows of a different color on a chart. In most cases, these arrows are golden-brown and have different directions. They indicate the moments of speculative transactions for scalpers, and the pointers show what action to take at the moment.
It is quite easy to trade with the use of this indicator. It is necessary to open a position following the signal of the arrow and close it when the line is colored in a different color.
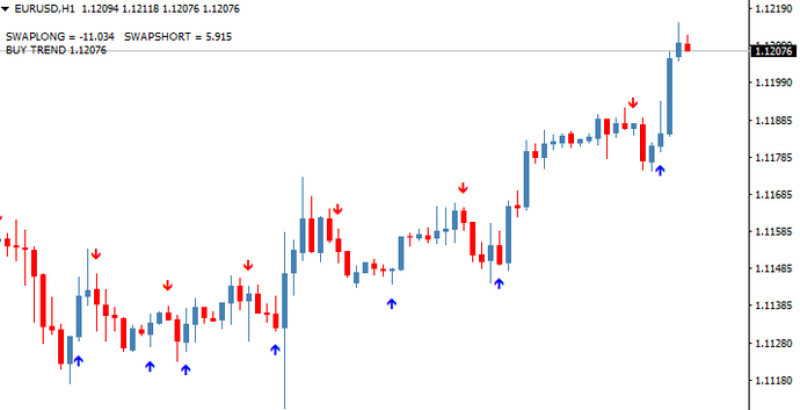
2.T3MA Alarm is an indicator based on a moving average as well. As the name suggests, this algorithm provides sound alerts while using three moving averages.
This indicators looks like three arrows of two colors and directions. When these arrows appear on a chart, a trader gets a sound alert.
For user convenience, this indicators also provides the data on swaps, the current trend, as well as the value of an asset in real time. In addition, due to the variety of settings, this algorithm works on any timeframes and with all available currency pairs.
At the same time, experts note its low effeciency in flat market conditions. If you decide to use this indicator, you'd better do it in the periods of high volatility.
As a rule, such periods coincide with events from the economic calendar. Therefore, from time to time it is worth studying it and keeping it in mind in the course of trading.
3. CHAMPION Forex Holy Grail is an indicator that has no limits on the number of currency pairs used and timeframes, although the most optimal are M5 or M15. As in the above cases, arrows serve to indicate the best points to open a position.
Its obvious advantages are no redrawing and no lags. Besides, it features a sound alert to notify traders about important signals.
CHAMPION Forex Holy Grail can provide false signals in flat market conditions.
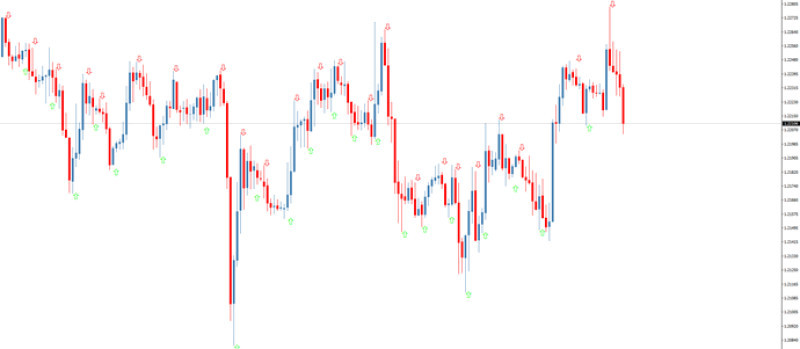
4. ZigZag Larsen Out & Alerts is an advanced variant of the popular ZigZag algorithm by Larsen. It is considered a classic example of an arrow indicator.
When a price changes direction, green arrows appear on a chart, signalling a buying opportunity, while red arrows mean favorable conditions for selling an asset.
The indicator settings allow you to change the market noise filtering bar, disable or enable alerts and email messages.
At the same time, experts recommend using this tool in combination with others. For example, Fibonacci lines or Murrey levels are suitable for confirming signals.
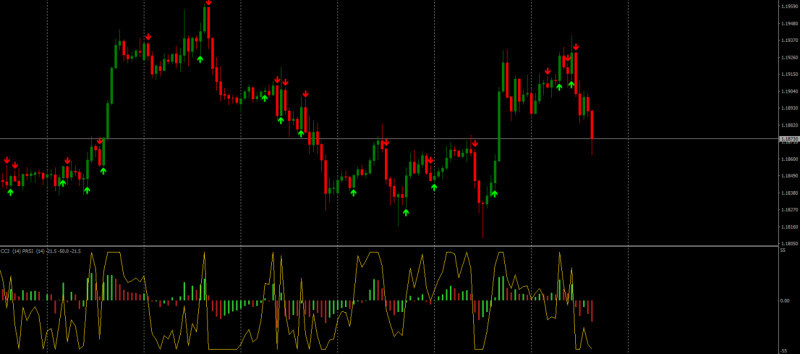
5. CCI Arrows is an indicator consisting of blue or green and red arrows. Blue or green arrows provide buy signals while red arrows indicate selling opportunities.
However, experts recommend not opening trades when the signals diverge from the quotes movement vector.
For example, if there is an uptrend and a blue arrow pointing up appears on the chart, it is a clear signal to open a buy trade. If the indicator is red and the trend is bullish, you should not buy an asset but close a long position instead.
When working with this indicator, it is also necessary to take into account the fact that it is lagging. It is possible to increase its effeciency with the help of the additional use of other indicators.
To configure this tool, you just need to select the CCI period, which is set at 14 by default. If this number is reduced, there will be more signals, but their accuracy will decrease, while the lower period will result in fewer but more accurate signals.
6. The Sidus indicator is of a compound type. It has been developed based on an exponential moving average and the Relative Strength Index.
We will provide more details about this algorithm below, but now we will only mention that the signal for buying is a green arrow and for selling is a red one.
Moreover, this indicator has several updated versions, so that a trader can choose the most suitable one.
7. Dots is a trend arrow indicator. It is effecient with any trading strategy.
This indicator is based on a МА. Signals are not indicated by arrows, but by dots of different colors.
Its default colors are blue and red, but they can be changed by users.
How to install an indicator on a trading platform
When a trader decides what arrow indicator to use, they may face a question: how to start using it? This is an especially urgent question for beginners who are just learning the basics of Forex trading.
The first three steps you need to take are to choose a brokerage company, open a real account with it and download a trading terminal. Below we provide some more details.
Nowadays, many companies provide brokerage services, and the key goal of a future trader is to choose one that works legally. You can check this by the availability of a license, which is usually presented on the websites of brokerage companies.
When choosing a broker, you need to:
- read traders' reviews about it
- analyze trading conditions and decide if they suit you
- find information about the broker's experience and reputation.
After taking these actions, you need to register an account and download a trading platform. It is quite easy to do, because brokers usually provide detailed step-by-step instructions on their websites.
After that, you need to download an indicator to your device - for example, a computer or laptop. For example, the link for downloading the Larry Williams Extreme's arrow indicator, developed by InstaForex, is placed directly under the description of this algorithm.
After that, you need to add a new algorithm to the trading platform. Let's see how it works on MetaTrader 4.
Step 1: Launch the trading platform and select the File tab.
Step 2: Go to the data directory and specify MQL, then go to Indicators.
Step 3: Copy the indicator downloaded to the device and paste it into the Indicators folder.
Step 4: Re-run a trading platform.
This is it: an arrow indicator is ready to be used on MetaTrader 4. To set it working, just click it with a left mouse button.
Besides, depending on the algorithm, you can configure it for more convenient and correct use. For example, select a time period, change the thickness of the arrows, enable alerts, and apply other adjustments.
By the way, do not forget that before you start trading, you also need to make a deposit. With no real funds, you can trade only on a demo account.
How to choose a suitable indicator
We have already underlined the importance of technical indicators in trading. In fact, trading without indicators is more like a casino than a well-organized financial activity.
Given this, many traders wonder how to choose the optimal algorithm that will suit them best. Here are some key criteria that you need to pay attentino to when choosing an arrow indicator:
1. Effeciency. In this regard, it is better to combine two methods of obtaining the necessary data.
First, the effeciency of indicators can be assessed based on users' reviews. Second, you can test an indicator yourself without risking big sums.
However, it is a mistake to assume that several successful trades in a row is a confirmation of the indicator's effectiveness. As a rule, testing should be carried out on 100-200 trades. An indicator is considered effective if at least 70% of its signals are correct.
2. If a trader wants to learn the basics about how the tool works, if necessary, adjust it based on personal preferences, then the algorithm code should be open.
3. Some arrow instruments demonstrate high efficiency during a flat market, others - during periods of increased volatility when important economic news is released. If you plan to trade in different market situations, you should consider using at least two types of arrow indicators.
For example, you can simultaneously use Solomon, which is most effective during high volatility, and Sidus, which is tuned for flat conditions;
4. If you do not want to regret wrong trading decisions, give preference to arrow indicators without redrawing. This ensures that the signals do not change during the trading process.
5. Along with arrow algorithms, it is important to use other tools to confirm the received signals. You need to take care of this in advance because it is risky to start trading with the use of arrow indicators only.
6. If you trade on a real account, you'd better use algorithms that do not lag. You can check this property on small transactions or on a demo account.
How to use Forex arrow indicators correctly
Simplicity is a distinguishing feature of arrow indicators. Both their looks and the process of using are simple.
But it is a mistake to believe that the use of arrow indicators guarantees error-free and profitable transactions. It is important to understand that losses are an integral part of a trading process.
All tools of technical analysis, including arrow indicators, are only guidelines that can help traders reduce losses to a minimum. A trader's experience, their personal qualities, as well as their existing skills and abilities have a huge impact on the result of trading.
That is, before you start using these algorithms in Forex trading, you need to accept the fact that you don't have a magical method of increasing capital at your disposal. Moreover, when using arrow indicators, it is important to follow certain rules.
Here are some of them:
1. Use several tools at once. It is quite easy to see a green arrow on a chart and immediately open a buy deal.
At the same time, it is important to make sure that other indicators provide the same signals. These are not necessarily to be arrow indicators.
Some of the suitable tools are RSI, Stochastic, MACD, and other.
2. If the first condition is met, this type of algorithm can suit any forex trader with no exception. For example, they will help beginners to navigate the market and to understand the key principles of trading.
3. Although all arrow indicators have a similar look, each of them is unique. While some of them are considered universal, most indicators are focused on a specific strategy.
4. In practice, most arrow indicators work better during periods of high volatility and definite trends. During a flat market, they can provide false signals.
At the same time, some arrow indicators are best suited to be used in flat market conditions.
5. The bigger the timeframe, the fewer signals an arrow indicator provides. At the same time, their quality is higher than in the case of smaller periods.
6. Most often, a trader needs to open a deal on a candle or bar following an arrow. Sometimes, other recommendations can be embedded into arrow algorithms.
7. Before switching to a real trading account with the use of arrow indicators, it is worth testing them on a demo account.
Practical example
Theory is important, but to better explain the principle of arrow indicators, we will provide an example of a strategy based on their use. We'll take the Sidus arrow indicator as an example.
This indicator is based on two moveing averages and the RSI indicator. The Sidus red arrows signal a selling opportunitty while green or yellow arrows recommend users to buy an asset.
It gives an alert to buy if two conditions are met:
- EMA of a smaller time frame is located above a fast moving average.
- The Relative Strength Index breaks the 50 level.
A sell signal is formed under opposite conditions.
For trading, we select the period of maximum volatility in order to achieve greater efficiency. We select the 4-hour timeframe, as it is considered an optimal option in this case.
The traded asset will be EUR/USD currency pair.
First off, you need to set periods. For that, select the following values:
- 14 and 21 for two exponential moving averages, correspondingly;
- 14 for the RSI.
When an indicator displays a green arrow, a trader needs to:
- Open a buy trade on a candle following the current one.
- Set a Stop Loss at a distance of 20 pips.
- As soon as a trader gets a profit of 15 pips, they should shift the Stop Loss to the level where the position was opened, and close a half of the trade.
- The remaining part of the trade should be propped up by a Trailing Stop placed at the distance of 15 pips as well.
An opposite trade, i.e. a sell one, is placed in the same way. The key difference is that the arrow should be red.
Conclusion
Arrow indicators can become good assistants in the trading activities for forex market participants. At first glance, these indicators can solve all the difficulties that traders may face.
After all, all you need is to react to a signal, close the deal when it changes to the opposite, and make a profit. In addition, you will not have to pay for the use of such indicators, because most of them are freely accessible, for the exception of some proprietary tools.
You just need to find the most optimal indicator, download it, add it to the trading platform and start trading.
At the same time, it is important to remember that the reaction to signals should be instant. And this skill is developed only through training and correction of mistakes.
Another important aspect is that these algorithms, as already mentioned above, are not universal and require the additional use of other types of indicators. After all, it is impossible to combine everything necessary for a full-fledged forex trading system into one tool.
Last but not least, it is important to understand that there are no ideal tools. Indeed, they help traders to analyze the market, but they do not give a 100% guarantee.
Statisticallly, at least 70% of successful transactions can prove that the use of a certain arrow indicator can be considered effecient. It can be checked during testing.
Read more
Bollinger Bands: strategy and way of use
MFI Indicator (Money Flow Index): complete guide
Awesome Oscillator: how to use
Support and Resistance Indicator MT4, MT5
VWAP Indicator (Volume Weighted Average Price)
MT4 indicators: how to install and use
Candlestick patterns Indicator for MT4, MT5
Forex volume indicators for MT4, MT5


