


How to define the best time to enter the market? You will find the answer to this question in the article "Best Forex indicators."
Here we are going to focus on forex trend indicators, why using them, and what indicators are the most reliable and trusted.
Important facts about Forex indicators
The forex market is a complex and multifaceted set of mechanisms. Practice shows that to generate significant profit in the market, it is not enough to open an account and download a trading terminal.
A successful trader uses tons of information when trading. To gain profit, traders need to predict the movement of the asset and make a timely trading decision based on the prediction.
Market experts have developed technical indicators to make forecasting as convenient and time-saving as possible. They are based on complex mathematical calculations confirmed through time.
These indicators show how the market is developing at the moment and suggest what may happen in the next few minutes, hours, or days.
This means that traders do not need to do any calculations. The program will perform them automatically and a trader will see the picture showing the asset’s price changes.
Based on these calculations, indicators can make forecasts as price changes have cyclical nature.
Notably, indicators are used not only on Forex. For example, they are applicable for CFD trading on stock exchanges, as well as on crypto markets.
Thus, the indicators provide an answer to the main question in trading: when to buy or sell an asset.
There are several classifications of forex indicators. One of them assumes three types as follows:
- Trend indicators help to determine the trend the market may move and understand where the price may move up or down
- Trend reversal indicators are a subtype of trend indicators
- Tools for key level and trading channel identification
Popular trading platforms - MT4 and MT5 - are equipped with a standard set of forex indicators. Users do not have to search for indicators on the Internet and add them to the trading platform.
Nevertheless, some traders use tailor-made indicators. These are the developments of specialists based on their own experience and observations.
What you need to know about using forex indicators:
- They are configured as part of the trading platforms, it is not difficult to work with them. The indicators can be monitored in a separate window or on the price chart
- You can adjust their elements. For example, you can change the thickness of lines, etc.
- It is possible to delete or add them.
- You can use more than one indicator to avoid false signals
- Your set of algorithms should fulfill different purposes, not just one.
Forex trend indicators
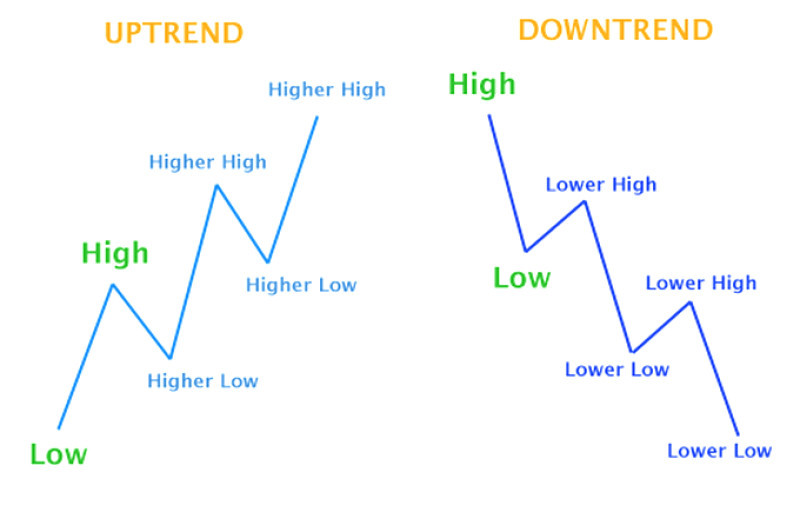
When we talk about a trend, we mean a specific movement in the value of an asset. The price can rise or fall and the movement can be upward or downward.
It can be compared to weather conditions. When the temperature outside rises for several days in a row, you can say it is warming, if it drops, it is getting colder.
Once the trend is defined, a trader can outline a trading plan and decide to buy or sell the asset.
Another possible scenario is to postpone making trades for some time if the market situation is uncertain.
You can determine a trend using the following ways:
- Analyze the asset’s chart. For example, if each time frame shows higher lows, we can talk about an uptrend
- Compare several trading pairs in which the asset is present. For example, if the euro as an underlying asset rises in several pairs, it can indicate an uptrend
- Mark the trend line. For example, if you connect several price lows with a line and the line rises, it indicates an uptrend. It is important to understand that the longer the time interval taken, the more accurate the line is
- Use the appropriate indicators. This option is considered basic.
Notably, trend indicators are universal in terms of application. They can be used by all traders without exception, regardless of what trading strategy they use.
Here are six of the most popular and reliable ones.
1. Varieties of Moving Averages, which are considered to be some of the most convenient and easy to use. Studies show that they are the most popular in the trading community.
In brief, this indicator shows the average value of an asset over time. There are several types of moving averages:
- Simple Moving Average (SMA)
- Exponential Moving Average (EMA)
- Smoothed Moving Average (SMMA)
- Linear Weighted Moving Average (LWMA)
The SMA and EMA are the most commonly used, so let's take a closer look at them.
The SMA algorithm uses the closing price of the asset for a specific time period and divides it by the number of these periods. The resulting curve line demonstrates the behavior of the price in the elapsed period and makes it possible to predict further movement.
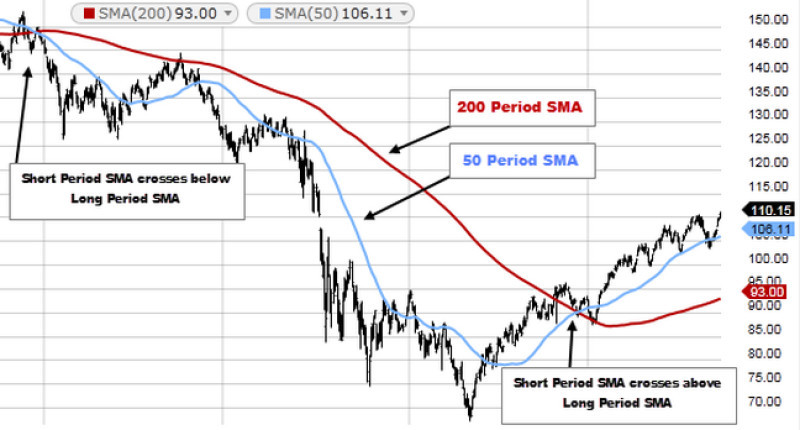
The longer the period of time applied, the flatter the line is and the lower its reaction to price corrections. As a result, the trader may not be able to timely react to the market situation and fail to make a profit.
At the same time, if a trader uses only small time intervals, his or her actions can be excessively fast and unreasonable due to market noise. Such haste is dangerous for successful trading.
What can become the best option?
According to professional traders, it is better to use this indicator only when the trend is clearly defined. Otherwise, there are high risks of encountering false signals and making wrong trading decisions.
The EMA handles the disadvantage of the SMA and reduces the lag to minimum values.
This is due to the fact that its calculation takes into account the share of the current closing price. That is, the newer the price is, the higher the priority it has.
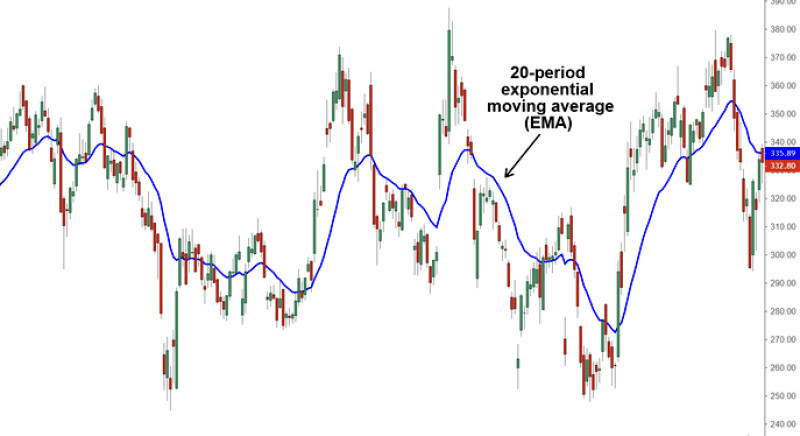
In general, all types of moving averages do not differ much. Nevertheless, they should be taken into account when trading. For instance, the EMA is considered to be the most dynamic indicator, while the fourth type - LWMA - is optimal for clear uptrends.
In any case, the choice of a particular indicator should be based on the personal preferences of a trader and the chosen trading style.
2. MACD is a Forex algorithm based on the convergence and divergence of moving averages, which we have already discussed above. Its main advantage is its flexibility.
The MACD algorithm is the difference between two EMAs of smaller and larger periods. The MACD is calculated by subtracting the 26-period EMA from the 12-period EMA.
The signal line is another component of this indicator. This is a nine-day EMA of the MACD line.
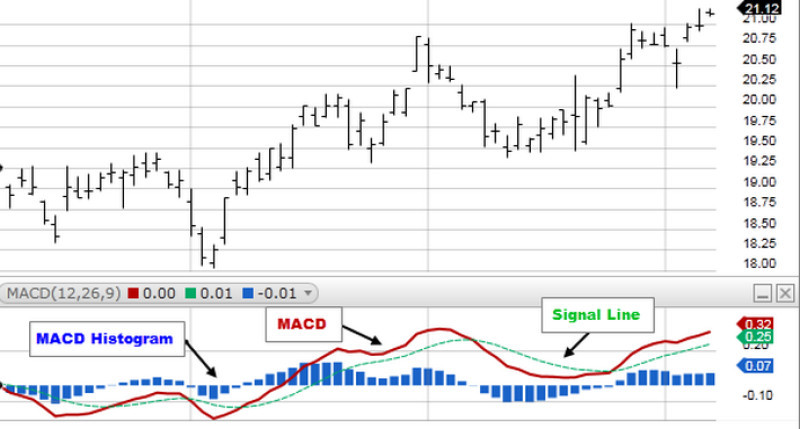
Using this indicator, traders monitor its intersections with the signal line. Traders may buy the asset when the MACD crosses above its signal line and sell the asset when the MACD crosses below the signal line.
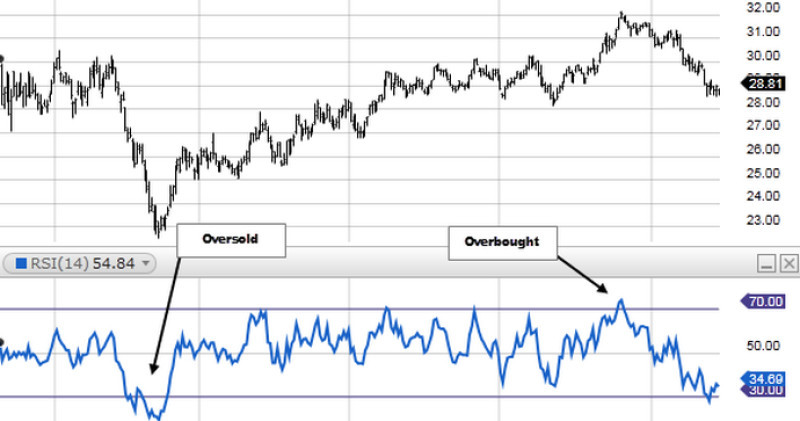
3. Relative strength index. It is used by traders who have a variety of strategies and trade different assets.
It is an oscillator that varies between 0 and 100. Depending on the range within which the price fluctuates, you can make a judgment about whether the asset you are trading is overbought or oversold.
The asset is overbought when bulls are controlling the market and the price has risen sharply. This means that we can expect the price to drop.
On the contrary, the asset is oversold when we see the opposite picture.
The RSI values of 30 or below indicate that a security is oversold.
A reading of 70 or above indicates an overbought condition.
Considering this, a trader can make a trading decision whether to buy an asset when it is likely to increase in price and to place it for sale when the price is expected to go down.
4. The Williams Alligator indicator. This indicator was developed by legendary trader Bill Williams, a well-known technical analyst.
The Alligator indicator uses three smoothed moving averages with different periods and shifts. The median price is used in their construction rather than the closing price of the asset.
The three moving averages comprise the Jaw, Teeth, and Lips of the Alligator. When these MAs are next to each other, it is as if the mouth is closed and the animal is asleep.
This means that the market is trading sideways or flat.
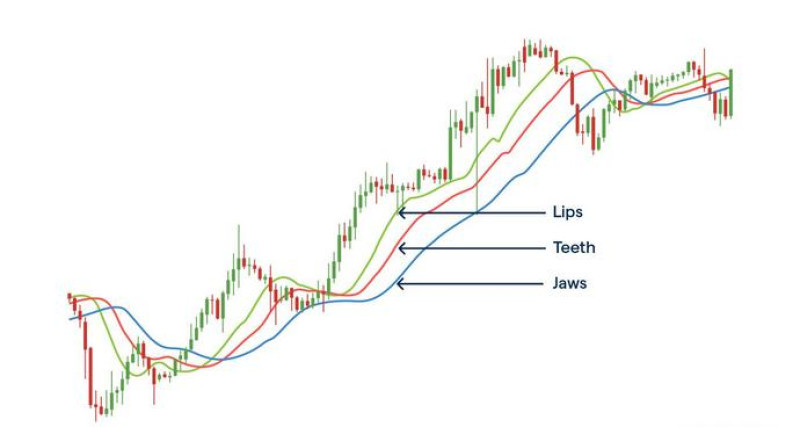
However, after some time, the alligator wakes up and begins to hunt. When the jaws open, the lines diverge, indicating the possible start of a new trend.
When the lines intertwine, the price is starting to move sideways.
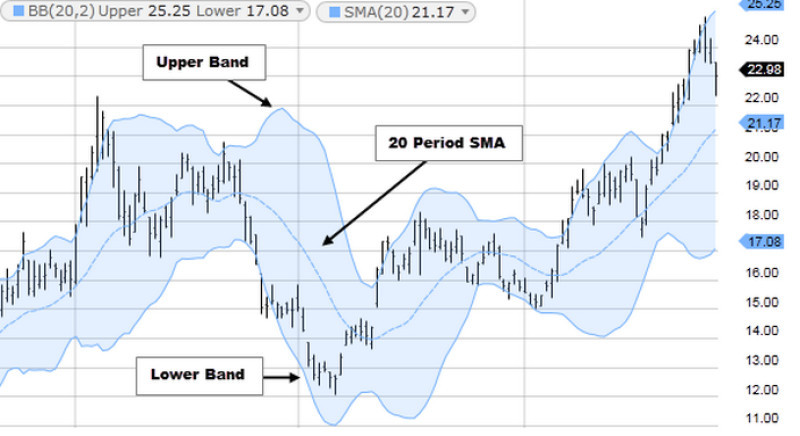
5. Bollinger Bands. This indicator uses standard deviations from a simple moving average. Three lines compose Bollinger Bands. They are a simple moving average (middle band) and an upper and lower band, forming a channel.
The trend can be determined with the help of the middle line. Thus, if the price is below the middle line, the indicator shows a downtrend.
When volatility increases, the channel becomes wider, and the distance between the boundary lines increases. When they diverge, we can say that the current trend will continue.
If the channel narrows, the trend may reverse soon.
6. The Average Directional Index, or the ADX, is a technical analysis indicator used to determine a trend and its strength. It allows you to predict whether it will end or continue.
The larger the value of this forex indicator, the higher the probability that the trend will continue to move in the same direction.
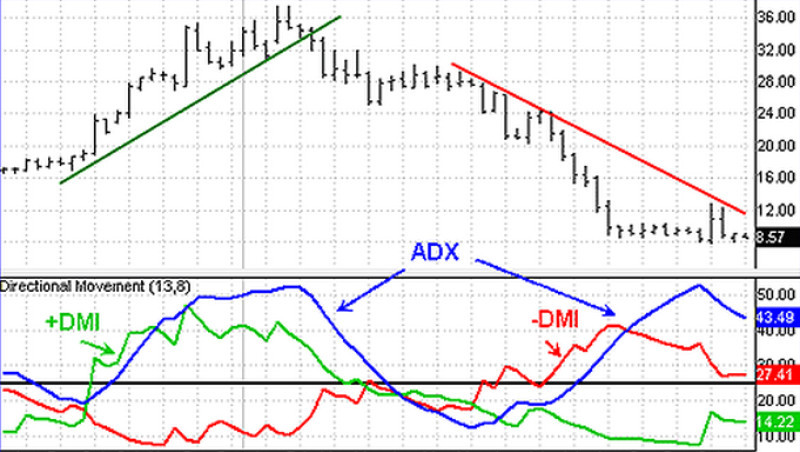
If the +DI line is above the -DI line, it means that bulls are dominating the market. If the opposite is true, bears are in control of the market. At the same time, the ADX value demonstrates how strong this trend is.
For example, if the indicator’s value is above 40, the trend may continue, and when it exceeds 50, it begins to weaken.
Forex trend reversal indicators
We mentioned earlier that a trend can be either upward or downward. At a certain period of time, a trend can reverse.
this moment is considered the most optimal for entering the market because transactions can become the most profitable. Therefore, the main task of any trader - both beginners and professionals - is to catch this moment.
To put it simply, traders should define when bulls outperform bears and vice versa.
That is why traders use reversal indicators when trading in the forex market. However, one should select them carefully because a mistake can hurt the deposit considerably.
Let's make it clear right away that we are not talking about a miraculous way to win a fortune. Even the most accurate and proven methods cannot indicate at what level the price of an asset will be in a minute or an hour.
Nevertheless, if you use reversal indicators correctly, the probability of a successful transaction will be higher.
The trend reversal indicators use the following:
- the trading volume of assets for a certain time
- supply and demand ratio
- market psychology including market participants’ sentiment
It is better to use a combination of indicators to predict the reversal as accurately as possible. In this case, their use will help you choose the best time to enter the market or have time to close an open position.
In addition, the comprehensive use of indicators will save the trader from false signals and noise, which quite often lead to undesirable and unpredictable consequences. After all, if there is not a reversal, but an ordinary correction, the transaction can bring losses.
When using reversal indicators, it is important to consider the following factors:
- depth of correction may signal a trend reversal. The deeper it is, the more likely it is that the current trend will consolidate
- if we are talking about a reversal, it should be confirmed by the volume of trading. Otherwise, quotes can easily return to the initial movement
Let's focus on several trend reversal indicators:
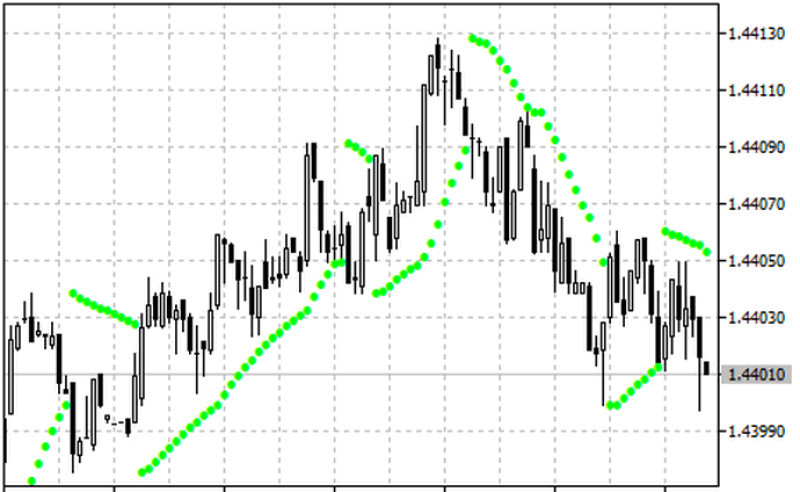
1. Parabolic SAR, which can be used independently or in combination with other indicators.
This indicator demonstrates the recommended level, which is marked on the chart with dots. If the price of the asset is within its limits, the trend does not change.
However, when the price crosses this curve, the direction of the price movement changes. The reversal of this indicator shows that the trend is over.
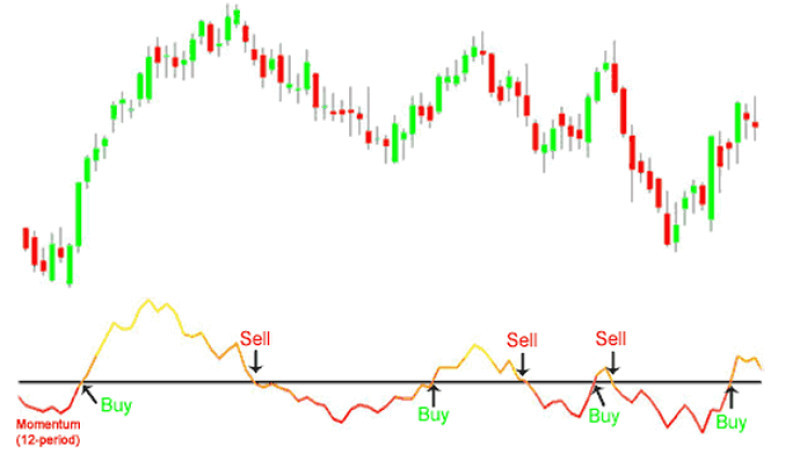
2. Momentum. Beginners usually use this indicator because it is simple. It has a separate interface, which is located below the asset chart.
The main advantage of Momentum is that in most cases it is moving ahead of the curve. This indicator is based on the following principles:
- a pit is formed before the upward reversal, and when the downward movement is approaching the top is formed
- the downtrend ends with a strong and rapid decline in price
- sharp fluctuations in the indicator signal that the value of the asset is close to the top
3. MACD. We have already mentioned this indicator above. The forthcoming reversal can be indicated by a significant difference between the charts of the asset value and the value of the indicator.
For example, when the price peaks and the indicator does not, the uptrend is over. This means that it will be changed by a downtrend.
Forex trend reversal indicators without redrawing
First, let's explain what these Forex tools are and how they differ from all the others.
This type of indicator does not redraw the previous signals to adapt them to the changed market conditions. That is, they do not allow the trader to make wrong trading decisions, relying on false signals.
In other words, they allow traders to make more precise and accurate forecasts. That is why traders appreciate them. Let's take a closer look at some of the most popular and reliable indicators of this type.
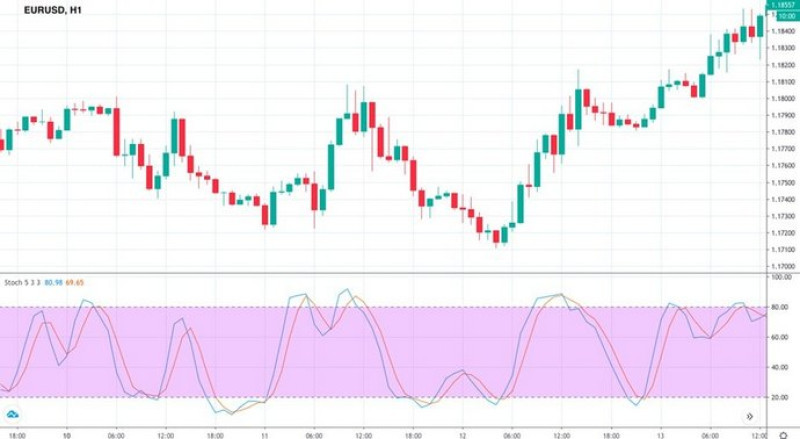
1. Stochastic oscillator. This indicator defines areas where an asset is overbought or oversold. Once the price reaches one of these areas, the current trend is likely to change.
The indicator shows a signal line and an indicator line, running between 0 and 100.
Let's assume they converge and go beyond the area bounded by 20 from below and 80 from above. This means that this is the optimal moment to buy or sell an asset.
2. Moving averages. We have already talked about them in this article. Notably, this indicator can be used with any trading strategy.
The effectiveness of this tool is confirmed by the fact that there are many tailored algorithms based on it.
At least two lines are used to predict a trend reversal. When they touch the real value, this signals a change of direction.
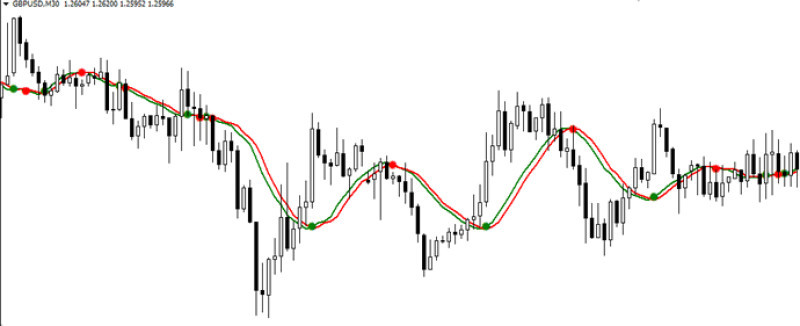
3. Q2MA is based on the MA. The indicator consists of two lines, one of which is the line of the trend, and the second is the moving average. It gives signals indicating a change in the trend in the form of circles located directly on the lines.
If you see green or yellow circles, you may buy the asset. Red circles show that it is better to sell the asset. In the first case, the indicator shows that the uptrend begins, and in the second case - a downtrend.
Most advanced forex trend reversal indicators
Everything is changing in the world and technology is constantly improving. Forex trading techniques do not stand still either.
New reversal indicators appear in the market. They are often based on existing indicators. Here are some examples.
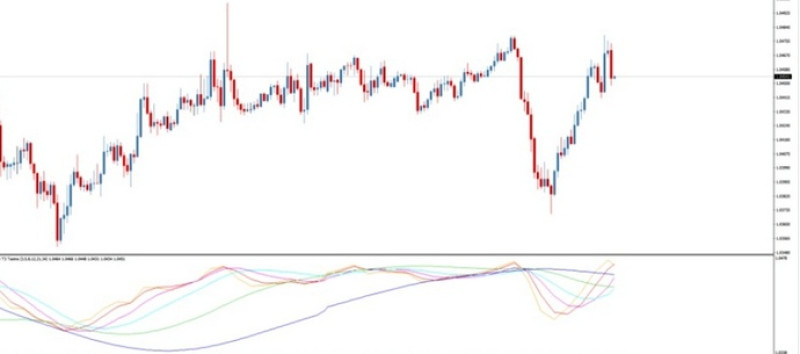
- Taotra functions on the MA already described in this article. That is, it is a set of moving averages, which have different periods.
The trend changes direction when all applied lines meet at one point.
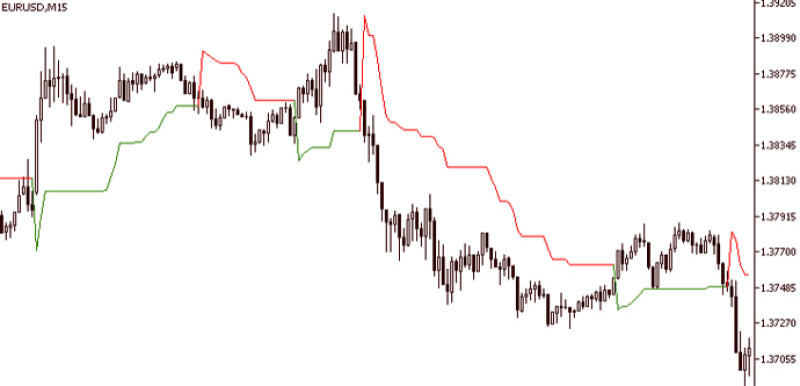
- Super Trend Profit Indicator also uses moving averages. It represents a line that changes its color when a trend reverses.
Taking all peculiarities aside, you can make a decision considering only the line’s color.
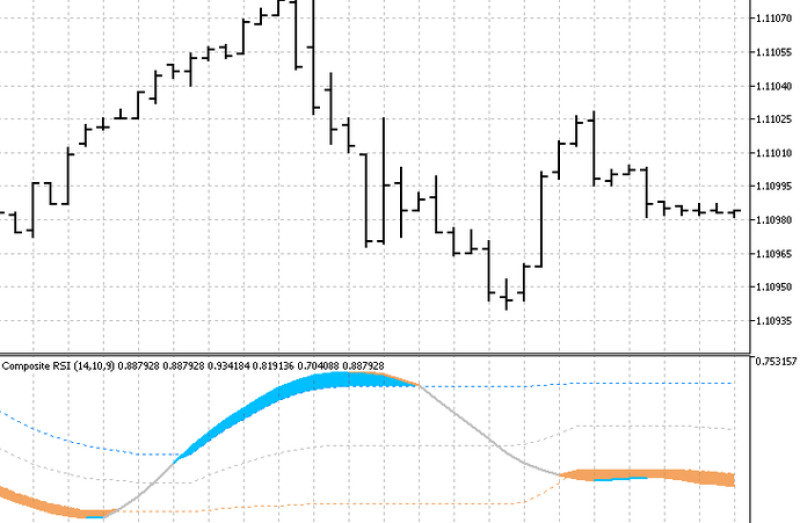
- Composite RSI includes the RSI and Floating Levels. The price of an asset changes the direction when the indicator breaks through the area bounded by the dotted line.
It is up to the trader to use indicators, the effectiveness of which has been confirmed by years of experience, or to use the newest ones. After all, one cannot say that some indicators lead to poor trading performance and others do not.
In addition, much depends on a trader and a chosen trading style.
Nevertheless, when using reversal algorithms - both long-established and the latest - it is important to adhere to the following rules:
- Use more than one indicator. It is better to use three indicators or more, combining them with oscillators.
- Before starting using indicators, make sure you have the right settings that suit you. Pay attention to the fact that some forex indicators may be customized for a certain currency pair
- In addition to technical indicators, use other assistants in your work - graphical patterns, price levels, Japanese candlesticks, etc.
- Some experts recommend pausing trading during important events in the economic calendar. At least do not risk too much in such periods.
Advantages and drawbacks
Forex trend indicators are essential for trading because traders should have a clear understanding of what direction a price may choose to go. Otherwise, trading can become chaotic. Trend reversal indicators also help to generate considerable profits from transactions.
Here are the advantages:
- Identification of the trend and its strength.
- Omitting false signals due to the wide functionality of settings.
- Absence of subjective estimation of the market situation. For example, unlike graphical patterns, traders can not interpret the result in their way.
- Availability and simplicity in use. We have already mentioned that some Forex trend indicators are already installed in trading terminals. In addition, a brokerage company can offer its own tools. The use of these algorithms does not require deep expertise.
- Universality. Most trend indicators are suitable for trading using different strategies.
Although trend-finding algorithms have some advantages, they also have disadvantages.
Drawbacks:
- Many algorithms are lagging. In the forex market, every second is priceless.
- It may take time to set the optimal settings of the indicator.
- None of the indicators can guarantee profits. Otherwise, the forex market would be predictable and trades of all its participants would be only profitable.
Conclusions
The bottom line is that trend indicators are one of the main advisors and assistants to any trader. Using these tools, market players can plan their market entry for generating significant profits.
When using the tools listed in this article, traders can define the prevailing trend as well as receive signals about its possible change.
Why is it important? It is difficult to overestimate the importance of the trend in trading.
A trend is considered a trader's main friend.
You may also like:
Wolfe Waves
Bollinger Bands: strategy and way of use
MFI Indicator (Money Flow Index)
Awesome Oscillator: how to use
Support and Resistance Indicator MT4, MT5
VWAP Indicator (Volume Weighted Average Price)
MT4 indicators: how to install and use
Candlestick patterns Indicator for MT4, MT5
Forex volume indicators for MT4, MT5
Forex arrow indicators for MT4


