The control level has become a stumbling block, what to expect next and whether it is still necessary to consider the recovery process - we will answer these questions in the article.
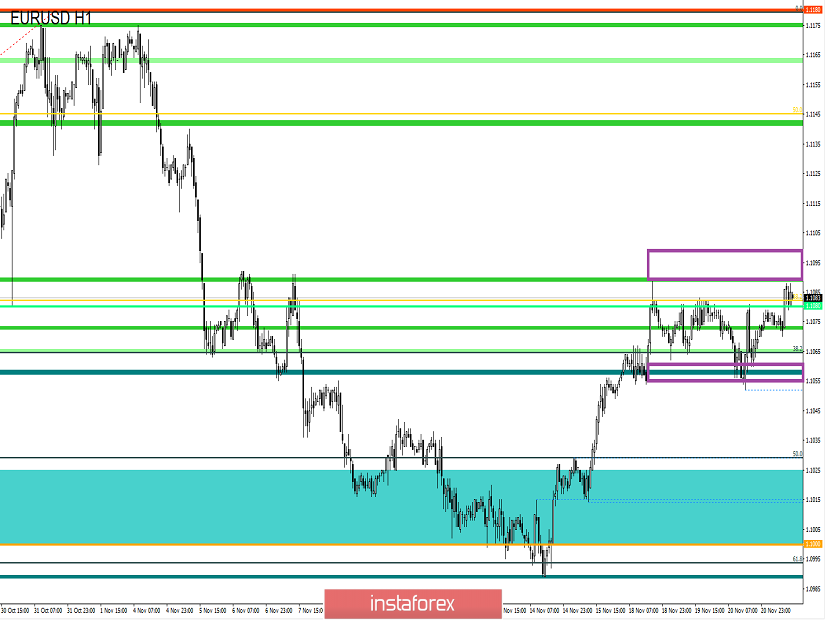
From technical analysis, we see how the range level of 1.1080 during the three trading days focused on itself, having a narrow accumulation phase of 1.1065/1.1080. There was an attempt of a downward move, but a clear breakdown of the area of 1.1060/1.1055 was not recorded, which resulted in a reverse movement, returning the quote to the range level. The characteristically low dynamics of the market did not give rest to many traders, as the decline in volatility paired with the accumulation gives a signal of momentum, which could not come. According to the law of logic and rational technical analysis, the acceleration, or the momentum, was considered in the downward direction, in the light that now, as it were, there is a recovery process and the first stage of 1.1080 plays the role of resistance. But it was not there, the earlier rebound from the second stage of 1.1000 quite strongly affected the volume of short positions, which are not just thinned, but, due to ambiguity, moved to the off-market stage. That is, trading volumes are low and they are expressed in sluggish sideways. This stage should not be delayed for a long time since this is not characteristic of the market, there is either a span or an expansion of the framework and the transition of accumulation to a full-fledged flat.
Analyzing hourly past day, we see that the activity is low, but it can be found in the characteristic interesting candles. So, please note that at the time of the attempt to break the area of 1.1060/1.1055, long positions rose sharply, which just brought us back to the level of 1.1080. (15:00-17: 00 trading terminal time).
As discussed in the previous review, speculators closely followed the framework of 1.1065/1.1080, in particular, the area of 1.1060/1.1055, where there was an attempt to breakdown, but there was a clear fixation of the price, while maintaining interest, and did not occur.
Looking at the trading chart in general terms (daily period), we see the same tedious recovery process, which was hampered by external factors, and in fact, the quote is still in an oblong correction (min-1.0879; max-1.1180).
The news background of the last day did not have in itself noteworthy statistics on Europe and the United States, but there was a publication of the text of the minutes of the meeting of the Federal Committee on Open Market Operations. Now, according to the minutes, most Fed members believe that the measures taken can support economic growth, a strong labor market and inflation near the 2% target. The most remarkable point was that the Fed officials consider negative interest rates an inappropriate tool of monetary policy in the United States. According to the regulator, negative rates can create complexity or distortion of the financial system. Regarding the December meeting, the information about the pause in the movement of the refinancing rate was confirmed.
Today, in terms of the economic calendar, we have the publication of the minutes of the ECB meeting, but the most interesting event will be tomorrow's speech by its head Christine Lagarde, who has long remained silent about the further actions of the regulator. Let me remind you that, according to recent data, the inflation rate in the EU has slowed down, which further pushes the regulator from the set target levels.
In terms of statistics, we have data on applications for unemployment benefits in the US, which should fall by 4K. After that, there will be data on sales in the secondary housing market, where an increase of 1.4% is expected.
Further development
Analyzing the current trading chart, we see a small impulse move that drove the quote just above the mark of 1.1080, but the pressure of the range level will remain. The breakdown of the control level has not yet occurred, so the area of 1.1095/1.1100 was not touched, and the fixing points are located below. In terms of volatility, the acceleration was conditional, as the indicators are still very low.
Detailing every minute available portion of time, we see the same jump, expressed in the period 10:00. Probably, the entry of Europeans into the market locally fueled interest, but the keyword here is "locally".
In turn, speculators are closely monitoring the control areas and points of flight relative to them, since, in connection with a three-day stop, there should be a jump in which you can make money.
It is likely to assume that the existing fluctuation within the range level will continue for some time, and special attention will be paid to areas such as 1.1060/1.1055 and 1.1095/1.1100. That is, in this case, the work carries a wait-and-see process, where in the case of identification of fixation points relative to the specified areas will allow the most optimal entry into the market. When analyzing fixation points, it is necessary to look at the breakdown structure of these areas to understand whether we have a false touch.
Based on the above information, we derive trading recommendations:
- Buy positions are considered if the quotation leaves the area of 1.1095/1.1100, not a puncture shadow.
- We consider selling positions in the area of 1.1060/1.1055, not a puncture in the shadow.
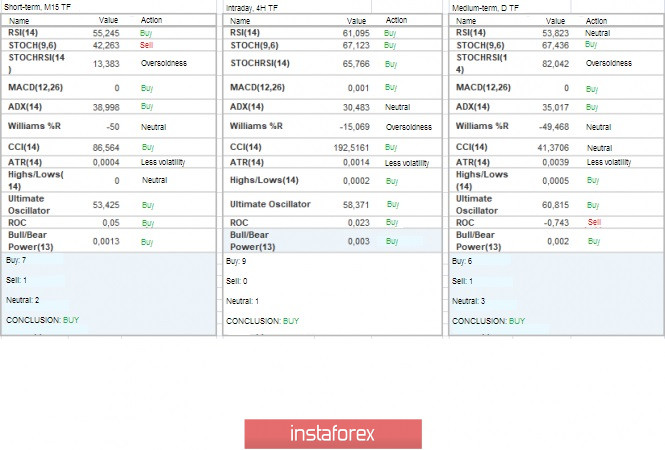
Indicator analysis
Analyzing different sector timeframes (TF), we see that the indicators have taken an upward position relative to all major time areas. It is worth considering that while the quote is still within the range level, the ambiguity expressed in unstable readings remains in terms of indicator analysis.
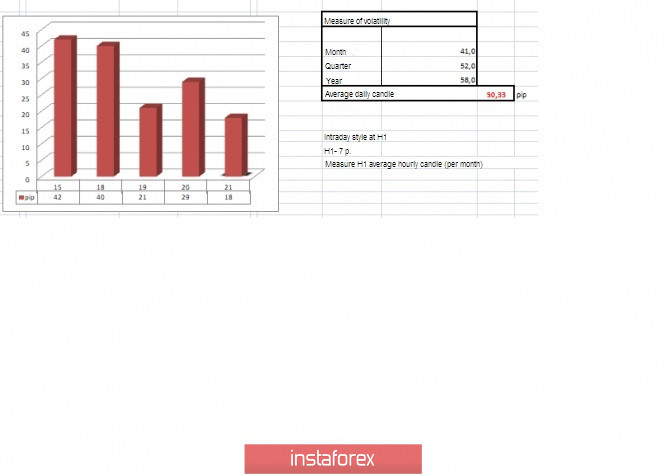
Volatility per week / Measurement of volatility: Month; Quarter; Year.
Measurement of volatility reflects the average daily fluctuation, calculated for the Month / Quarter / Year.
(November 21 was built taking into account the time of publication of the article)
The volatility of the current time is 18 points, which is still far from the daily average. It is likely to assume that if the hovering within the given areas continues, then volatility will still be at low levels. At least some acceleration can occur in the case of the passage of the specified coordinates.
Key levels
Resistance zones: 1.1080**; 1.1180* ; 1.1300**; 1.1450; 1.1550; 1.1650*; 1.1720**; 1.1850**; 1.2100.
Support zones: 1.1000***; 1.0900/1.0950**;1.0850**; 1.0500***; 1.0350**; 1.0000***.
* Periodic level
** Range level
*** Psychological level
***** The article is based on the principle of conducting transactions, with daily adjustments.