From a complex analysis, we see three events at once: the breakdown of the range level, the breakdown of accumulation, and the expected resumption of the recovery process. For three days in a row, the quote moved along the range level of 1.1080, having a rather narrow oscillation amplitude of 1.1070/1.1100. The process of peculiar accumulation was unwavering, which led many to think of the coming surge in the activity. Thursday was the starting point in our rally, where, against the backdrop of the ECB meeting, accumulation was no longer able to hold back borders and we saw a sharp surge in short positions. The existing activity immediately lowered the quote to the area of 1.1035, where a point of variable support was found against the background of local oversold and a pullback. Everything that happened above again led to a broad discussion of the recovery process, in connection with the breakdown of the first stage (1.1080), relative to the oblong correction. The recovery theory has been rumored by traders for a very long time, referring to the fact that the main downward trend did not suffer from the existing correction, and everything that happens is similar to the history of the fall of 2018. As you may have guessed, it is a pattern that underlies the theory, and it surprisingly works.
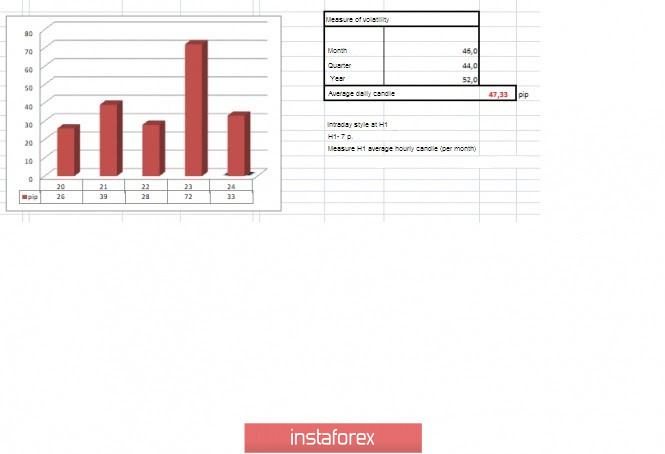
In terms of volatility, we see a long-awaited acceleration, where 72 points were recorded last day, which is 53% higher than the daily average. Let me remind you that since the beginning of the trading week, the average volatility index was 31 points, and the minimum value was 26 points.
Analyzing the past day by the minute, we see that the main increase in activity occurred in the period at 15:30-18:00 (time on the trading terminal). The subsequent oscillation was in terms of rollback/stagnation with a small amplitude.
As discussed in the previous review, traders were at a low start due to significant accumulation, where the trading tactics were chosen using the method of breaking the set boundaries with the entrance to the impulse candle, which turned out to be an extremely profitable strategy.
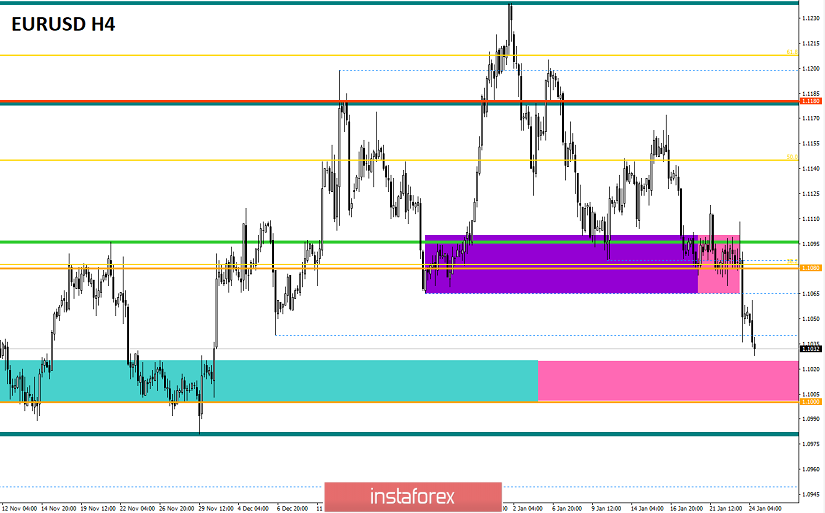
Looking at the trading chart in General terms (the daily period), we see signs of recovery relative to the oblong correction. Recovery steps: #1-1.1080; #2-1.1000; #3/1-1.0950; #3/2-1.0879.
The news background of the previous day included data on applications for unemployment benefits in the United States, where the indicators were good, primary applications increased by 6 thousand, and repeated applications decreased by 37 thousand.
The market reaction to the statistics was paired with a general decline.
The main event of the day and week was the ECB meeting, where the regulator left the key interest rate unchanged without any surprise.
"The Governing Council expects that the ECB's key interest rates will remain at their current or lower levels until it sees that the inflation forecast is steadily approaching a level close enough, but below 2% within its forecast horizon, and this convergence is consistently reflected in the dynamics of core inflation," the ECB said in a statement.
The main reaction of the market to such an important event came after the press conference with Christine Lagarde. So, we expected a lot from her because the secrecy regime before the meeting was great. As a lever for the media, there were rumors that Lagarde would announce plans to revise the regulator's strategy, which will be revised for the first time since 2003. The "X" hour has arrived, and the ECB head confirms the launch of the monetary policy review, which will be completed by the end of this year.
Today, in terms of the economic calendar, we had preliminary data on the Eurozone PMI, where we expected optimistic indicators, but were disappointed. So, the composite index of business activity in the manufacturing sector (Markit) remained unchanged at 50.9 with a forecast of growth to 51.2. At the same time, the index of business activity in the services sector (Markit) fell from 52.8 to 52.2.
In the second half of the day, similar data will be released - for the United States, the manufacturing sector is expected to grow from 52.4 to 52.5, and in the services sector - from 52.8 to 52.9 (Markit).
The upcoming trading week in terms of the economic calendar is expected to be saturated, which is worth only one meeting of the Federal Reserve System, which will certainly cause interest among speculators.
The most interesting events displayed below:
On Monday, January 27
USA 16:00 London time - Sales of new homes (m/m) (Dec): Prev 1.3% ---> Forecast 0.8%
On Tuesday, January 28
USA 14:30 London time - Orders for durable goods
On Wednesday, January 29
USA 20:00-20:30 London time - Fed meeting, followed by a press conference
On Thursday, January 30
EU 11:00 London time - the unemployment rate
USA 14:30 London time - GDP (preliminary)
On Friday, January 31
EU 11:00 London time - GDP (preliminary)
Further development
Analyzing the current trading chart, we can see that the inertial downward trend was successfully set during yesterday's rally, and small stops in the course structure served as platforms for regrouping trading forces. The recovery theory now looks great in comparison with other arguments, and the point of the subsequent support of 1.1000 is not far away.
In terms of the emotional component, we see an influx of not only local speculative positions but intraday ones, which can not but please in terms of market acceleration.
Detailing the available trading day every minute, we see that after the stagnation/pullback that took place in the Pacific – the beginning of the European session, it turned into a resumption of the downward course, where the minimum of the previous day was broken and the price is trying to fix below it.
In turn, traders continue to work on the downside, where there are partial fixing of trading operations, and the main prospect is the psychological level of 1.1000.
It is likely to assume that such a rapid downward move will not be able to be constantly maintained by inertia and we will need a stop, which is currently considered within the psychological level of 1.1000. Thus, you should not be greedy, fix previously opened short positions, leaving optimal volumes in the market. Subsequent bays will occur after the price is fixed below the reference level of 1.1000.
Based on the above information, we derive trading recommendations:
- Buy positions will be considered in case of a rebound from the psychological level of 1.1000.
- Positions for sale are already being held by traders, where fixes are made. Right now, opening a position is considered a risky idea, since the price is extremely close to the psychological level of 1.1000.
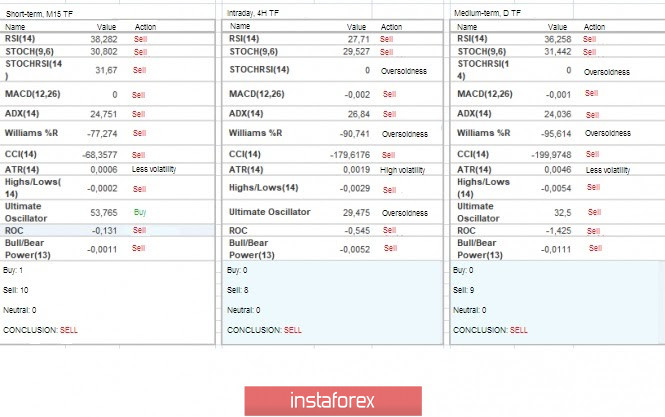
Indicator analysis
Analyzing different sectors of timeframes (TF), we see that the indicators of technical instruments unanimously signal a sale due to a sharp surge in the activity of short positions.
Volatility for the week / Volatility measurement: Month; Quarter; Year.
The volatility measurement reflects the average daily fluctuation, based on the calculation for the Month / Quarter / Year.
(January 24 was based on the time of publication of the article)
The current time volatility is 33 points, which is close to the average. It is likely to assume that there is still a chance of further volatility growth against the background of the growth of speculative positions.
Key levels
Resistance zones: 1.1080**; 1.1180; 1.1300**; 1.1450; 1.1550; 1.1650*; 1.1720**; 1.1850**; 1.2100.
Support zones: 1.1000***; 1.0900/1.0950**;1.0850**; 1.0500***; 1.0350**; 1.0000***.
* Periodic level
** Range level
*** Psychological levels
***** The article is based on the principle of conducting a transaction, with daily adjustments.