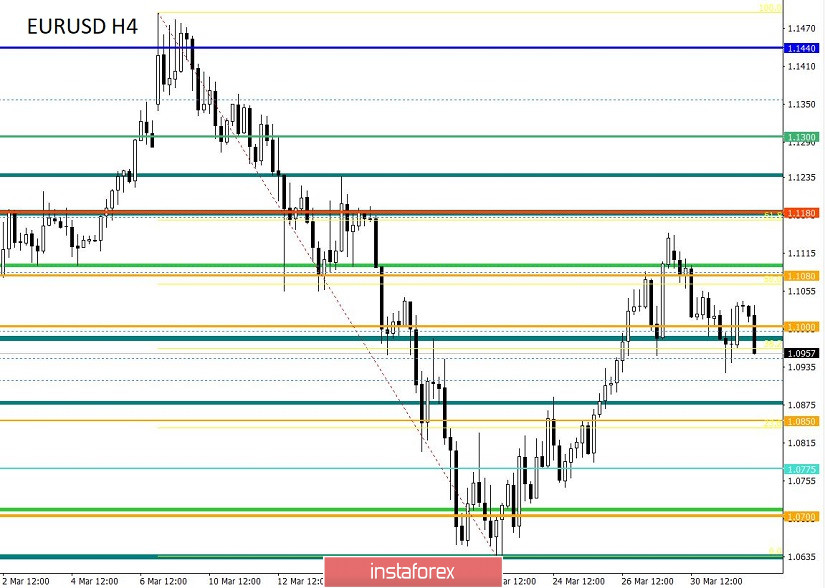
From the point of view of complex analysis, we see a local round of short positions, which temporarily lowered the quote to 1.0950, but it did not lead to anything fundamental, and now let's talk about the details. The surge in the downward trend of the past days turned out to be local, because after some fluctuations and a decline of the price to the level of 1.0926, everything returned back above the psychological level of 1.1000. With such an amplitude, outlines of the characteristic side movement arose, where the values 1.0960 / 1.1080 became variable frames. In fact, the pressure is inherent in both currencies. Here, the main question is who is currently harder in local nature?
As you have already noticed, almost all of my recent articles deal with temporary fluctuations without a clear trend, since the external background is very large and the consequences of the COVID-19 virus affect all countries without exception. Thus, it turns out that as soon as we see the primary: results / conclusions / statistics / reports, there is pressure on a particular currency and, as a fact, its weakening.
At the same time, the overflow of assets into the US dollar is almost an inevitable story, and it is always present, since the main impulse of the global economy and assets is located in the west. Thus, assets spontaneously concentrate where there are fewer risks, and since risks are now around the world, it is easier to concentrate them where stability is higher.
In terms of graphical analysis, traders began to notice the "Head and Shoulders" pattern at the peak of the upward movement from last week, where the Neck line has a downward slope.
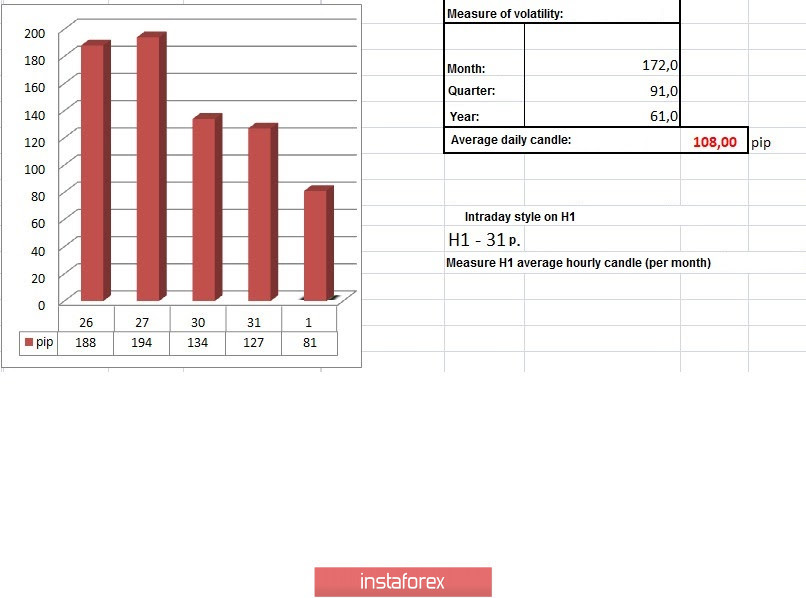
Regarding volatility, we see that there is a decrease in activity for the second day in a row, which signals two possible factors at once: The first option reflects the possible adaptation of speculators to the external background, which has already happened on history more than once; The second option is the opposite of the first, and it reflects a kind of readiness for further acceleration. It is worth considering that even the current activity of 127 points exceeds the daily average activity by 17%, and the acceleration lasted almost two months.
Details of volatility: Monday - 155 points; Tuesday - 183 points; Wednesday - 115 points; Thursday - 278 points; Friday - 166 points; Monday - 151 points; Tuesday - 234 points; Wednesday - 243 points; Thursday - 326 points; Friday - 194 points; Monday - 191 points; Tuesday - 160 points; Wednesday - 133 points; Thursday - 188 points; Friday - 194 points; Monday - 134 points; Tuesday - 127 points. The average daily indicator, relative to the dynamics of volatility is 108 points [see table of volatility at the end of the article].
Analyzing the past day, we see a V-shaped model, where a downward spiral appeared at the moment of the start of the European session, and a sudden change in direction occurred around 11:00 UTC+00, at the moment when the quote touched the value of 1.0926. As a result, the V-shaped model completed the formation and turned into accumulation.
As discussed in the previous review, traders were in active profit taking from short positions at the moment when the quote reached the level of 1.0950. Further positions should have arisen after fixing the price lower than 1.0900.
Considering the trading chart in general terms [the daily period], we see a fluctuation in the structure of upward inertia from last week. Violation of the structure of the course so far, the inertia production of less than 50%.
The news background of the past day contained data on inflation in the eurozone, where a slowdown to 0.7% was recorded. This inflation rate indicates once again that there is a risk of lowering the refinancing rate of the ECB and should not be excluded from the analysis. Against this background, the dollar has moved to strengthen.
In terms of the general informational background, we see that the epidemiological situation and the spread of COVID-19 in the world continues to set anti-records, and so, as of 05.00 (Universal time) from 04/01/2020, the increase per day was 9.3% [+72,780 infection in the world]. In turn, the peak of the disease in America has not yet begun, but the growth of infected people already has a scale of more than 20 thousand cases daily.
Against this background, the Federal Reserve [Fed] announced on Tuesday the launch of a temporary lending mechanism for foreign central banks, which will allow regulators to convert their US government bonds into dollars. Thus, the Fed is trying to ease tensions in global markets during the pandemic.
In simple words, the Fed acts as a central bank for the whole world, striving to provide the world financial system with the liquidity that it needs.
Today, in terms of the economic calendar, we have yet another shocking data on the labor market in the United States, where, according to the ADP report, employment should be reduced by more than 150 thousand, and this should be the first decrease since 2017. Thus, the US dollar will be under local pressure again, losing its position.
Further development
Analyzing the current trading chart, we see that the accumulation within the region of 1.1000 / 1.1040 led to a local surge in short positions, eventually returning the quote to the lower border of the variable range, which was discussed at the beginning of the article [1.0960 / 1.1080]. It is worth considering that there is a risk of a local weakening dollar in the afternoon at the time of publication of the ADP report. Prior to the announcement of the data, a temporary chatter on the base is not excluded, that is, focus on 1.0960 and the minimum of the past day 1.0926. For more significant changes in terms of the downward movement, we need to gain a foothold lower than 1.0900, but this is not so simple either, since the external background, paired with data on the US labor market, does not have this step. Thus, we need a general weakening of the background. As you can see, we consider exclusively local positions with a perspective of 1-2 days, with a constant review of goals,
In terms of emotional background, we see the preserving pressure of external factors, due to which speculative activity is still high.
By detailing the per minute available time interval, we see just the very accumulation of 40 points that arose during the Pacific and Asian sessions. At the start of the Europeans, local positions increased for sale, returning the quote to the area of 1.0960.
In turn, traders are waiting for the most suitable moment to enter, where sell positions will arise after the passage of the area of 1.0900 / 1.0925, but buy positions will arise already higher than 1.1050. Speculators worked on the accumulation process, where they entered local positions at the time of its breakdown, positions are already closing
It can be assumed that, if, frankly, not the best data on the labor market is confirmed, the dollar will be under pressure, and after lunch, we will analyze the possible points for long positions, if any. In any case, a pending buy order is already at the level of 1.1050.
Based on the above information, we derive trading recommendations:
- We consider buying positions in case of fixing higher than 1.0950, with the prospect of 1.1080-1.1145. Further progress is considered after fixing the price higher than 1.1155.
- We consider selling positions in case of price fixing lower than 1.0900, with the prospect of a movement to 1.0850-1.0775.
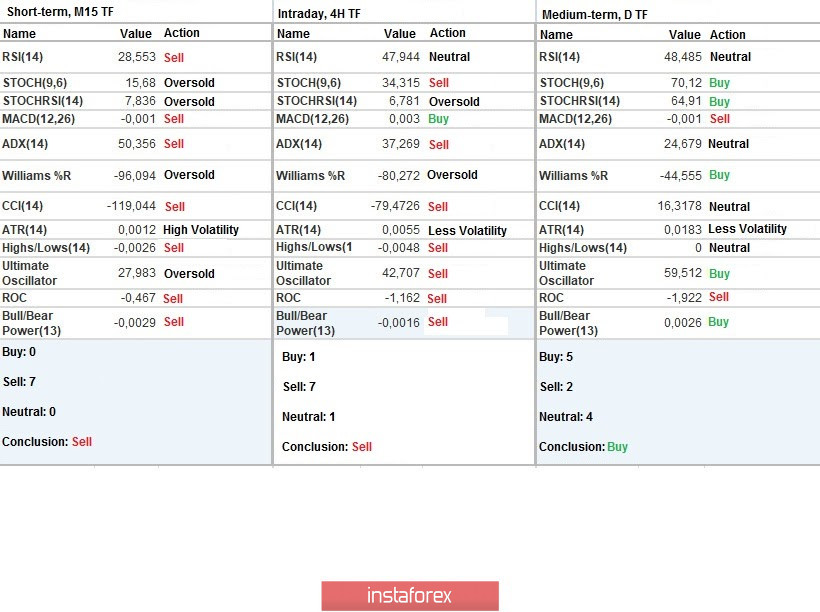
Indicator analysis
Analyzing a different sector of timeframes (TF), we see that the minute and hour periods occupy a sell signal due to the morning turn of short positions. Daytime periods still reflect the upward trend of the past week.
Volatility per week / Measurement of volatility: Month; Quarter; Year
Measurement of volatility reflects the average daily fluctuation calculated from Month / Quarter / Year.
(April 1 was built taking into account the time of publication of the article)
The volatility of the current time is 81 points, which is already close to the average daily indicator, and this is only the beginning of trading. It is likely to assume that acceleration awaits us ahead, first on the general background, and then on statistics.
Key levels
Resistance zones: 1,1000 ***; 1.1080 **; 1.1180; 1.1300; 1.1440; 1.1550; 1.1650 *; 1.1720 **; 1.1850 **; 1.2100
Support areas: 1.0850 **; 1.0775 *; 1.0650 (1.0636); 1,0500 ***; 1.0350 **; 1,0000 ***.
* Periodic level
** Range Level
*** Psychological level