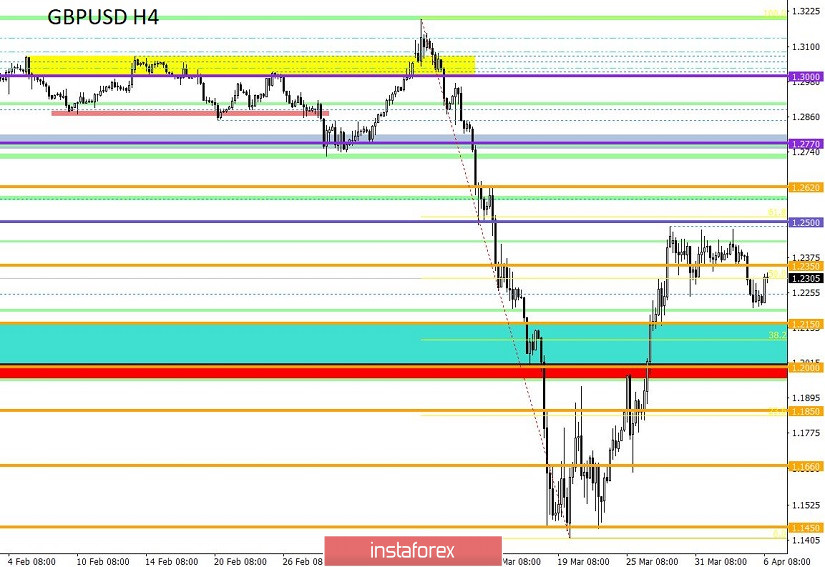
From a comprehensive analysis, we see the first significant change and I suggest that we analyze the details. The entire past week has been squeezed in the range of 1.2280//1.2380//1.2480, where the activity dropped over time and the oscillation amplitude contracted. A cardinal change occurred only on Friday, where the compression reached its limits and was replaced by an impulse that overcame the lower limit of its aisle and there were impulses that led the quote to the area of 1.2200. In fact, this is the first significant change since the beginning of the week, and now the main question is, how stable is it? If we turn our attention to other trading instruments, for example, the euro/dollar, we will see that the dollar with all its problems with the labor market continues to strengthen, which means that investors trust it and pour their assets into it. Returning to the pound, we note that the dynamics differ from the correlating pair (EURUSD), but the strengthening of the dollar here was more significant a period earlier. Traders assume that now there is another accumulation of trading forces, where a return to historical lows is a possible scenario for the future.
As for our trading tactics, everything is always the same, the work is done on local operations, and the key technical elements are the last fluctuations, relative to which a forecast of a possible local move is made.
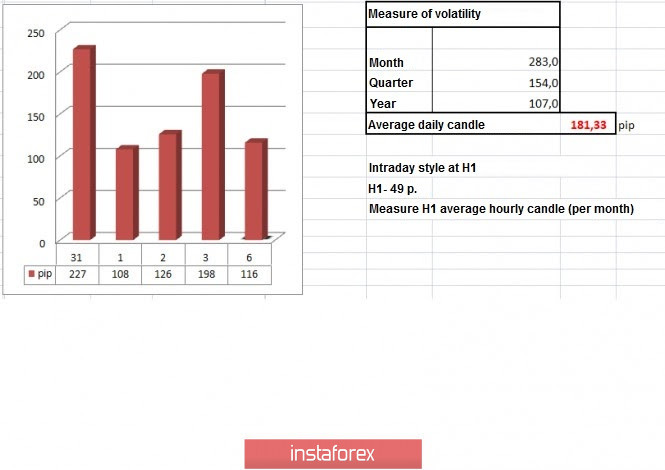
In terms of volatility, we see that after two consecutive decelerations, there was an acceleration that again exceeded the daily average by 9%. Of course, this is not the same fluctuations that we saw in the middle of March, but we are still in the acceleration stage.
Details of volatility: Monday-165 points; Tuesday-245 points; Wednesday-172 points; Thursday-358 points; Friday-359 points; Monday-144 points; Tuesday-271 points; Wednesday-676 points; Thursday-354 points; Friday-522 points; Monday-267 points; Tuesday-296 points; Wednesday-333 points; Thursday-452 points; Friday-352 points; Monday-148 points; Tuesday-227 points; Wednesday-108 points; Thursday-126 points; Friday-198 points. The average daily indicator, relative to the dynamics of volatility is 181 points (see the table of volatility at the end of the article).
As discussed in the previous review, traders considered short positions just at the breakdown of the lower border of the flat, but the first predicted level of 1.2150 has not yet been reached by the quote.
Looking at the trading chart in general terms (the daily period), we see only two main inertia, where there was a stagnation from the accumulation of Doji candles, which reflects the characteristic instability of the structure.
Friday's news background had the index of business activity in the British services sector, where a decline was expected, but everything turned out to be much worse. The PMI fell from 53.2 to 34.5, and the composite PMI fell from 53.0 to 36.0. After that, the report of the United States Department of Labor became the center of attention, where the market was subjected to a new shock, since the acceleration of decline has not been seen for a very long time. So, the number of jobs in the agricultural sector decreased by 701,000. According to the forecast, they were waiting for a decrease of 150,000 In other words, we expected the worst and got even worse, but we don't stop there, since the unemployment rate in the United States accelerated from 3.5% to 4.4%, with a forecast of 3.8%.
The market reaction to all this was interesting, so the dollar, contrary to the principles of fundamental analysis, continued to strengthen, repeating the story of Thursday, when after the publication of stunning data on applications for unemployment benefits in the US, the dollar did not react in any way.
Experts are inclined to believe that such an unusual reaction is due to the fact that investors see the possible consequences of the COVID-19 virus in other countries, where there will be nothing better, and the dollar will be the most attractive currency due to the general risk.
Today, in terms of the economic calendar, we had data on business activity in the construction sector in the UK, where, without too much surprise, a decline was recorded from 52.6 to 39.3, with a forecast of 44.0.
Further development
Analyzing the current trading chart, we see a return of the quote to the flat corridor of 1.2280//1.2380//1.2480, where the activity is extremely low. In fact, there is still a chance of resuming the downward development, but to start, the quote needs to focus on the area of 1.2200, otherwise the probability of maintaining fluctuations within the framework of a sideways move will be higher than usual.
In terms of the emotional background, we see that market participants are strongly influenced by panic, where the external background leads to a violation of the laws of technical and fundamental analysis.
We can assume a temporary oscillation in the range of 1.2200/1.2350, which will also be a signal of a change in the earlier inertia. The main step in the development is still fixing the price below 1.2200.
Based on the above information, we will output trading recommendations:
- Positions for sale are considered in two options: the first is lower than 1.2270, with the prospect of a move to 1.2220; the second option comes from the main development, where the quote needs to be fixed below 1.2200, with the prospect of a move to the psychological level of 1.2000.
- Buy positions are considered in the event of a resumption of fluctuations within the flat. In this development, the quote should be fixed higher than 1.2350, with the prospect of a move of 1.2400-1.2450.
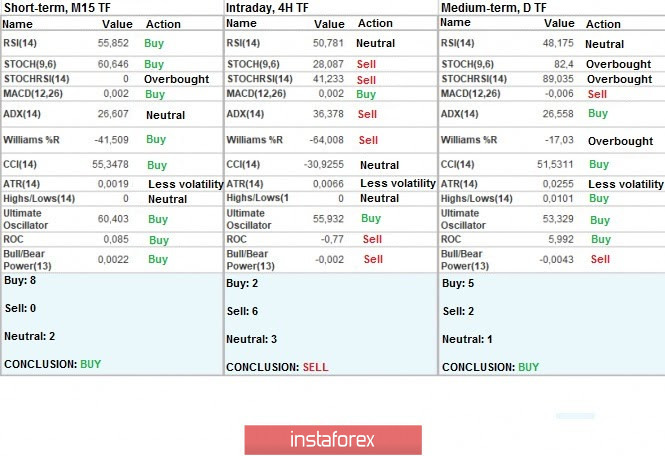
Indicator analysis
Analyzing different sectors of timeframes (TF), we see that the indicators of technical instruments have a variable signal due to the preservation of price fluctuations within the flat framework. At the same time, daily intervals reflect earlier inertia, which still reflects the high level of the quote.
Volatility for the week / Measurement of volatility: Month; Quarter; Year.
Volatility measurement reflects the average daily fluctuation, calculated for the Month / Quarter / Year.
(April 6 was based on the time of publication of the article)
The volatility of the current time is 116 points, which is even less than the daily average. It can be assumed that if the downward trend is resumed, the acceleration can easily exceed the average.
Key levels
Resistance zones: 1.2350**; 1.2500; 1.2620; 1.2725*; 1.2770**; 1.2885*; 1.3000; 1.3170**; 1.3300**; 1.3600; 1.3850; 1.4000***; 1.4350**.
Support zones: 1.2280 (1.2240); 1.2150**; 1.2000*** (1.1957); 1.1850; 1.1660; 1.1450 (1.1411); 1.1300; 1.1000; 1.0800; 1.0500; 1.0000.
* Periodic level
** Range level
*** Psychological level
**** The article is based on the principle of conducting a transaction, with daily adjustments.