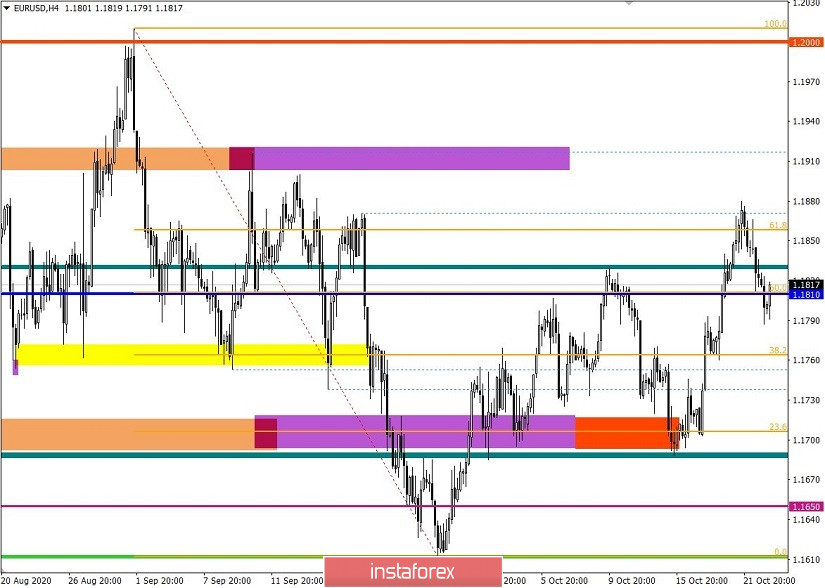
As expected, the EUR/USD pair came under the influence of the natural basis in the area of 1.1850/1.1900, where the upward inertia slowed down and the corrective move took place.
The area of 1.1850/1.1900 is known for the accumulation in the period of September 10-18, where market participants regarded it as a kind of resistance, reducing the volume of long positions.
In this case, several technical factors played a role, which led to a reversal of the quote:
- Local overbought due to the rapid inertial movement during the period of October 19-21.
- Interaction area of trade forces 1.1850/1.1900, which served as a starting point for lowering buyers' volume.
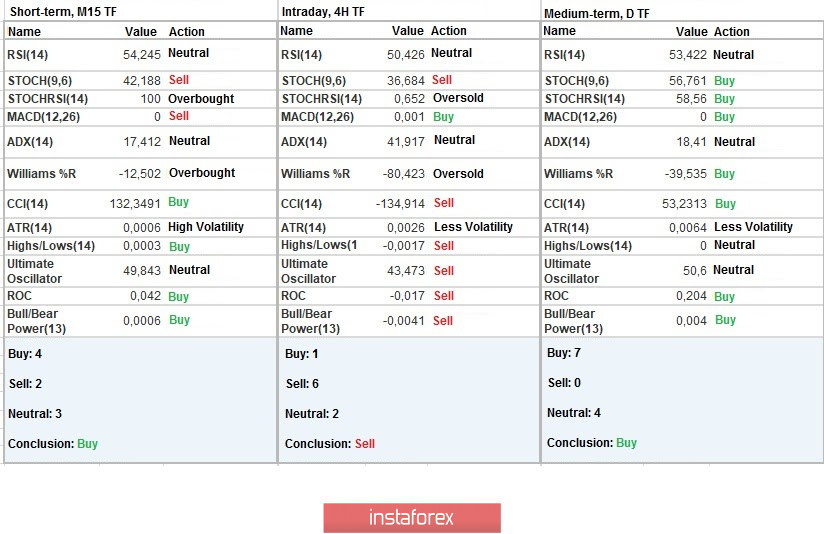
Taking a look at yesterday's fifteen-minute TF, you can see that short positions have major shares, which returned the quote to the area of the recently overcame level of 1.1810. It will be clear from speculative interest whether this will signal a more impressive recovery relative to the scale of the entire correction 1.1612 ---> 1.1880, since it is the one dominating the market.
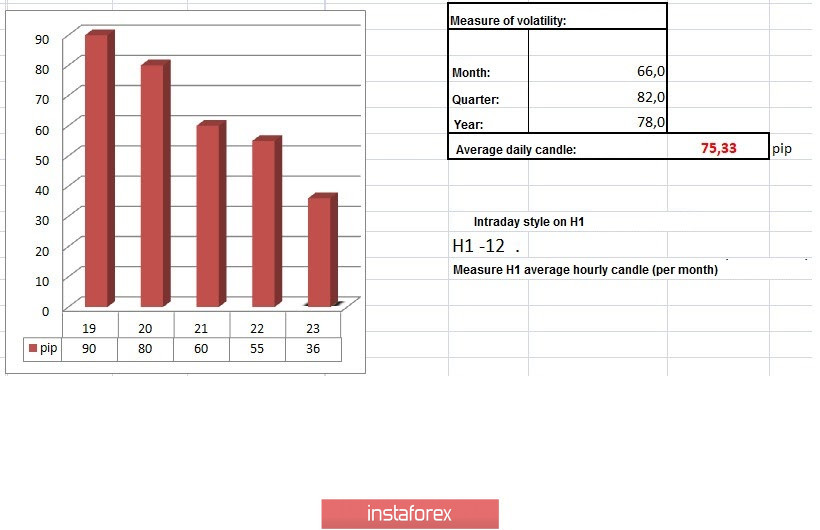
In terms of daily dynamics, 55 points were recorded yesterday, which is 26% below the average. It should be noted that impulse fluctuations were encountered relative to hourly time frames, where the coefficient of speculative transactions is high.
Looking at the trading chart in general terms (daily period), the recovery process relative to the September decline can be seen. However, everything can still change, which can lead to the continuation of the downward trend.
Yesterday's news background included US weekly data on applications for unemployment benefits, where they recorded an impressive volume decline. So, repeated applications exceeded the 10 million mark for the first time, which was considered a kind of psychological threshold (10,018,000 ---> 9,397,000). Moreover, initial applications also pleased with their next reduction – from 898,000 to 840,000, although it was expected to grow to 915,000.
In turn, the recovery in the labor market positively influenced the US dollar's strengthening.
In terms of the economic calendar, we do not have preliminary data on business activity in Europe today, where a decline in the index is predicted, which may affect the euro rate.
Services PMI: Prev. 48.0 ---> Forecast 47.0
Manufacturing PMI: Prev. 53.7 ---> Forecast 53.1
In the afternoon, they will publish a similar indicator, but for the United States, where their indices are expected to remain practically at the same level.
Services PMI: Prev. 54.6 ---> Forecast 54.6
Manufacturing PMI: Prev. 53.2 ---> Forecast 53.4
The focus of the next trading week will be on Friday, where there is a meeting of the European Central Bank (ECB), as well as preliminary data on US and EU GDP.
[All time zones are in Universal time]
Monday, October 26
USA 14:00 - New Home Sales in September
Tuesday, October 27
USA 12:30 - Orders for durable goods for September
Thursday, October 29
USA 12:30 - Claims for unemployment benefits
USA 12:30 - Preliminary GDP for Q3
EU 12:45 - ECB meeting
EU 10:30 - Press conference and ECB commentary on monetary policy
Friday, October 30
EU 10:00 - Preliminary GDP (Q3)
EU 10:00 e - Preliminary Inflation
Further development
Analyzing the current trading chart, you can see the quotes' fluctuation within the level of 1.1810, where a consolidation has already been made below it, which can be a good signal for a further decline.
If the price is not consolidated above 1.1835, we can expect a following decline in the direction of 1.1760-1.1720.
As an alternative scenario, a temporary sideways fluctuation within the limits of 1.1790/1.1835 is not excluded.
Indicator analysis
Analyzing different sectors of time frames (TF), we see that the technical indicators have a variable signal. So, the hourly TF signals a recovery stage relative to the activity surge of the period earlier – a sell signal. In contrast, the daily TF reflects a belated buy signal, focusing on inertia.
Weekly volatility / Volatility measurement: Month; Quarter; Year
Measurement of volatility reflects the average daily fluctuation, calculated per Month / Quarter / Year.
The volatility of the current time is 36 points, which is 52% lower than the average. If the corrective move is held, volatility may continue to grow.
Key levels
Resistance zones: 1.1810; 1.1910; 1.2000 ***; 1.2100 *; 1.2450 **; 1.2550; 1.2825.
Support zones: 1.1810; 1.1700; 1.1650 *; 1,1500; 1.1350; 1.1250 *; 1.1180 **; 1.1080; 1.1000 ***.
* Periodic level
** Range level
*** Psychological level