EUR/USD 5M
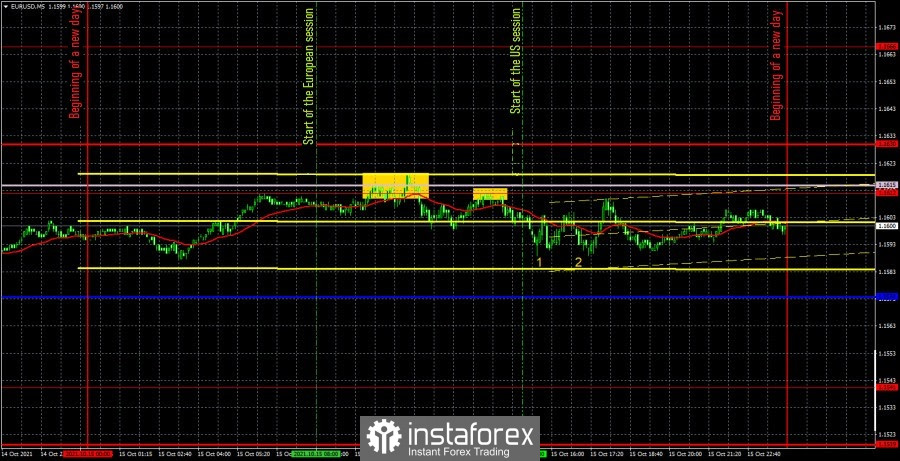
The EUR/USD pair was trading with little volatility again last Friday. This time the price passed exactly 30 points, which fully corresponds to the overall picture of the situation. Recall that the pair has been trading with such volatility for a long time, which greatly complicates the trading process. However, there is nothing we can do about it. In our other articles, we have already said that the best option in the current situation would be either trading on the highest timeframes (that is, on long-term), or on the lowest timeframes (5M). However, as we can see, not only is there a weak movement on the 5M timeframe, but also a full flat. And it is especially not recommended to trade in a flat. And what do we have in the end? On Friday, volatility was ultra-weak, and in addition, there was also a complete flat. Also on Friday, two reports were published in America that had no impact on the pair's movement. And what kind of market reaction can we talk about if the pair only passes 30 points in a day? Thus, reports on retail sales and consumer sentiment do not even make any sense to consider. Now let's go directly to trading and consider the only signal that was formed on Friday. The price bounced off the Senkou Span B line and the 1.1612 level, which should have been interpreted as a sell signal. However, as it is easy to guess, this signal did not bring any profit to traders, since the price failed to reach the nearest target level – the Kijun-sen line. Nevertheless, it went 20 points down, which was enough to place a Stop Loss order at breakeven, at which the sale transaction eventually closed.
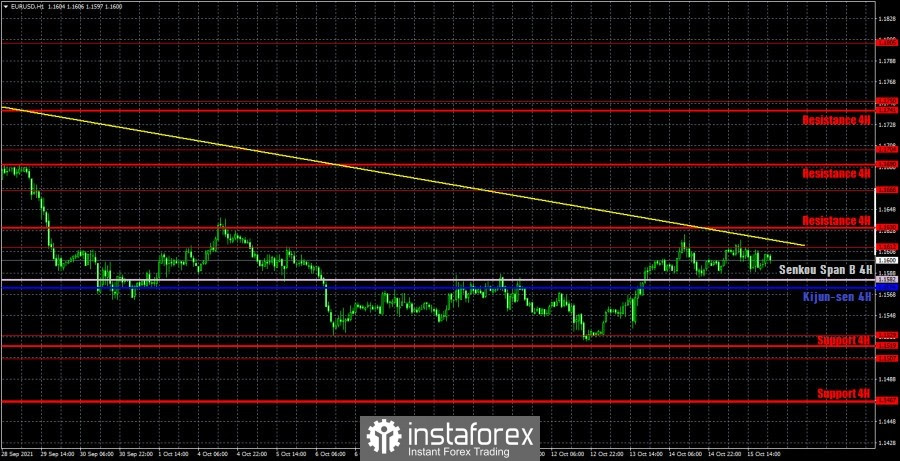
EUR/USD 1H

You can see that the euro/dollar pair has nevertheless adjusted to the downward trend line on the hourly timeframe and may resume the downward trend in the near future. The situation is now quite contradictory for the pair, since on the 4-hour TF according to the Linear Regression Channels system, the price is above the moving average, and on the 4-hour TF according to the Ichimoku system, the price cannot overcome the Senkou Span B line. Therefore, further upward movement is not obvious, given the insurmountable trend line on the hourly TF. We highlight the following levels for trading on Monday - 1.1507, 1.1529, 1.1612 and 1.1666, as well as the Senkou Span B(1.1615) and Kijun-sen(1.1574) lines. The lines of the Ichimoku indicator may change their position during the day, which should be taken into account when searching for trading signals. Signals can be rebounds or breakthroughs of these levels and lines. Do not forget about placing a Stop Loss order at breakeven if the price moves 15 points in the right direction. This will protect you against possible losses if the signal turns out to be false. No important report or other event scheduled in the European Union on October 18. A relatively important report on industrial production for September will be released in America, which, however, is unlikely to cause a market reaction. Most likely, today will be another boring day with low volatility.
We recommend you to familiarize yourself:
Forecast and trading signals for GBP/USD on October 18. Detailed analysis of the pair's movement and trade deals.
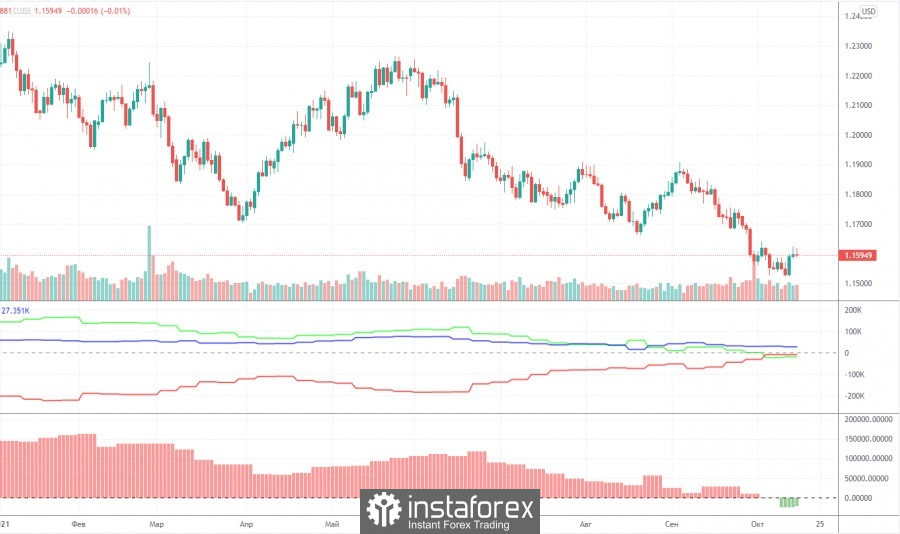
COT report

The mood of non-commercial traders practically did not change during the last reporting week (October 5-11). It even became a little less bearish. But all the same, it is already bearish, since for the first time in a long time the total number of open short positions for the "non-commercial" group exceeds the total number of open buy contracts (222,000 versus 203,000). During the reporting week, professional traders opened 5,700 buy contracts (longs) and 2,400 sell contracts (shorts). Thus, the net position increased by 3,300 contracts, but such a change is considered negligible for the general picture of things. We draw attention to another fact. At the beginning of this year, the net position of big players exceeded 150,000, and since then the European currency has fallen in price by only 6 cents, and the net position has lost about 170,000 contracts. We believe that the European currency has depreciated too weakly, given the changes in the data on contracts from professional players. We also draw attention to the fact that the euro is falling very weakly. As we have calculated more than once, by about 15 points a day. Every day, but the volatility still remains very weak. The weak volatility makes you doubt everything that is happening now with the pair. The US dollar still does not look like a currency that may show a strong trend in the near future. But, nevertheless, it continues to grow for more than a month. As a result, the Commitment of Traders (COT) reports now show a very likely continuation of the euro's decline. But we also recommend correlating these findings with the current technical picture.
Explanations for the chart:
Support and Resistance Levels are the levels that serve as targets when buying or selling the pair. You can place Take Profit near these levels.
Kijun-sen and Senkou Span B lines are lines of the Ichimoku indicator transferred to the hourly timeframe from the 4-hour one.
Support and resistance areas are areas from which the price has repeatedly rebounded off.
Yellow lines are trend lines, trend channels and any other technical patterns.
Indicator 1 on the COT charts is the size of the net position of each category of traders.
Indicator 2 on the COT charts is the size of the net position for the non-commercial group.