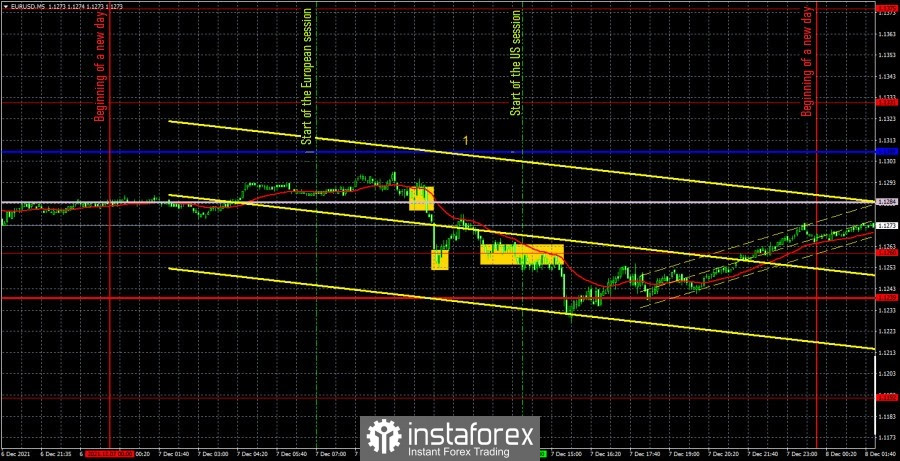
EUR/USD 5M

The EUR/USD pair was trading with a downward bias on Tuesday. Volatility was about 70 points, which is quite a decent value for the EUR/USD pair. Thus, the quotes of the European currency are slowly continuing to decline, which fully corresponds to the general trend, which is especially clearly visible on the hourly timeframe. No important macroeconomic statistics released in either the US or the European Union on Tuesday. There were several reports that day, but they provoked no reaction. We can only note the GDP report for the third quarter in the third estimate, which, in fact, did not differ in any way from the second - 2.2% q/q. A report on business sentiment from the ZEW Institute could also be highlighted, but it was even less significant than GDP. Thus, the number "1" in the chart marks the time of publication of the European reports, but as we can see, nothing has changed much since their release. Therefore, all we have to do is analyze all the trading signals of the day and understand how one should trade on Tuesday. The first sell signal was formed when the pair settled below the Senkou Span B line. It should have been worked out with a short position, which could have been held open until the rebound from the extremum level of 1.1260. One could earn about 14 points on this deal. A rebound from the level of 1.1260 could already be regarded as a buy signal and also worked it off with a long position. However, in this case, the pair could not reach the nearest target level and could not go up 15 points either. Therefore, it was not possible to set Stop Loss to breakeven, and the long position was closed after the pair settled below the level of 1.1260 at a loss of 14 points. However, this consolidation should also be regarded as a signal to sell and open new short positions. Subsequently, the price dropped below the support level of 1.1239, but again failed to continue its downward movement and returned to the area above this level, where the shorts should have been closed. The profit was about 10 points. Thus, despite the more or less good movement, it did not work to earn much on Tuesday.
EUR/USD 1H
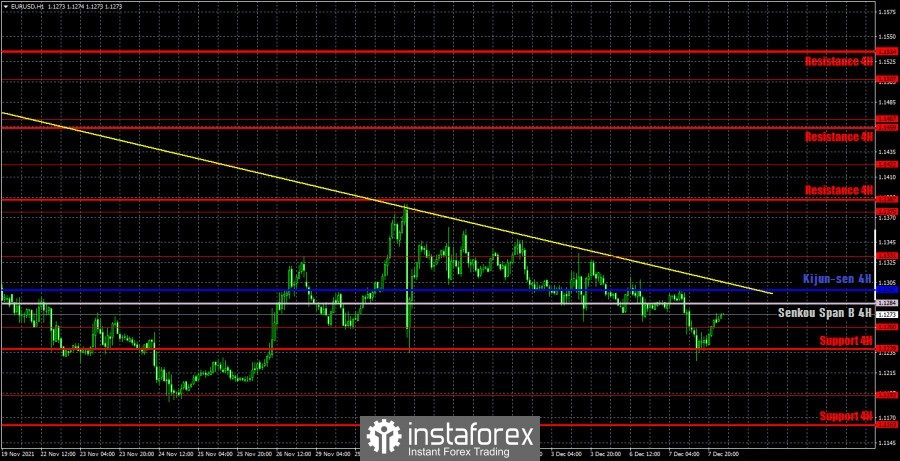
On the hourly timeframe, the pair continues to be below the downtrend line, therefore, the trend continues to remain downward. The pair also continues to be below the lines of the Ichimoku Kijun-sen and Senkou Span B indicator, therefore, the euro's further fall looks much more attractive than the growth. For buying the pair, it is best to wait for the price to settle above the trend line. We highlight the following levels for trading on Wednesday - 1.1192, 1.1260, 1.1331, 1.1375, 1.1422, as well as the Senkou Span B (1.1297) and Kijun-sen (1.1284) lines. The Ichimoku indicator lines can change their position during the day, which should be taken into account when looking for trading signals. Signals can be rebounds or breakthroughs of these levels and lines. Do not forget about placing a Stop Loss order at breakeven if the price moves 15 points in the right direction. This will protect you against possible losses if the signal turns out to be false. On December 8, the only highlight of the day will be the speech of European Central Bank President Christine Lagarde. Thus, it is unlikely that today traders will trade under the influence of the fundamental or macroeconomic background. Even Lagarde's speech may not provide anything in terms of new information. This is because the head of the ECB has repeatedly commented on the economy and monetary policy.
We recommend you to familiarize yourself:
Overview of the EUR/USD pair. December 8. The foreign exchange market is still calmly reacting to the new Omicron strain, but the dollar is still growing.
Overview of the GBP/USD pair. December 8. Boris Johnson's political ratings are declining. And this is a problem for the British Premier.
Forecast and trading signals for GBP/USD for December 8. Detailed analysis of the movement of the pair and trade deals.
Analysis of the COT report
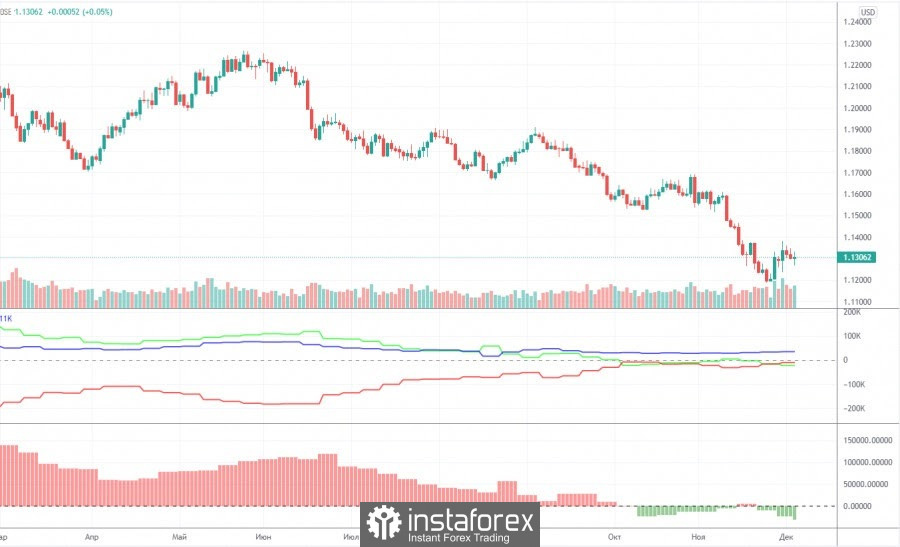
The mood of non-commercial traders became more bearish again during the last reporting week (November 23-29). Judging by the indicators in the chart above, the changes are not so big anymore, but still most professional traders continue to either increase shorts or reduce longs. The non-commercial group closed 15,000 Buy contracts (longs) and 8,500 Sell contracts (shorts) during the reporting week. Thus, their net position decreased by 6,500 contracts. Indeed, a little. The green line of the first indicator has been near the zero level for a long time. And this, by and large, means that the number of open longs and shorts for non-commercial traders is approximately the same. And this, in turn, means that the mood is now more neutral than bearish. But still, almost every week there is an increase in this "weak bearish mood", so now we can conclude that the European currency has excellent chances to continue falling. We just want to remind you about the factor of the market working out the reasons that could bring the dollar so high against the euro. From our point of view, the US currency as a whole continues to grow due to the fact that the probability of tightening the monetary policy of the Federal Reserve is much higher than the probability of tightening the monetary policy of the ECB. Especially now, when EU countries are beginning to close for quarantine and break anti-records on morbidity. However, the dollar has been growing for a very long time, and the Fed, in fact, has only reduced the QE program by $15 billion and that's it. Thus, the factor of a high probability of tightening the Fed's monetary policy has been worked out several times for a long time.
Explanations for the chart:
Support and Resistance Levels are the levels that serve as targets when buying or selling the pair. You can place Take Profit near these levels.
Kijun-sen and Senkou Span B lines are lines of the Ichimoku indicator transferred to the hourly timeframe from the 4-hour one.
Support and resistance areas are areas from which the price has repeatedly rebounded off.
Yellow lines are trend lines, trend channels and any other technical patterns.
Indicator 1 on the COT charts is the size of the net position of each category of traders.
Indicator 2 on the COT charts is the size of the net position for the non-commercial group.