empty
 
 
10.01.2022 12:00 PM
USD/CHF technical analysis on January 10, 2022

The dollar strengthened at the beginning of the week

Hello!

Today, another major pair USD/CHF will be analyzed. Using Friday's weekly trading close, it is recommended to start with the corresponding time frame.

Weekly

This image is no longer relevant

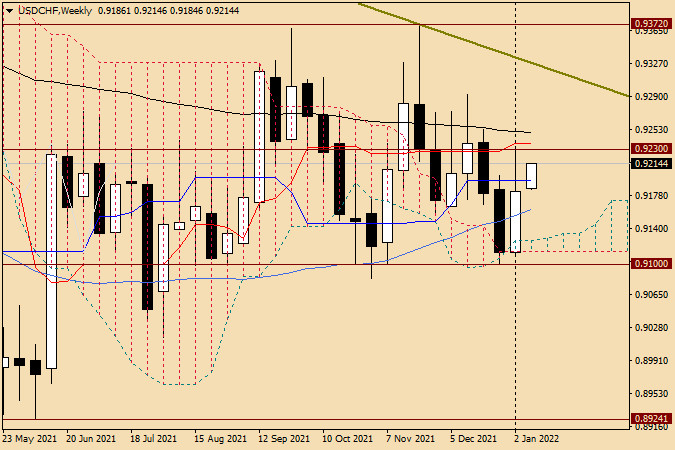
Despite the fact that trades closed with gains on January 3-7, further price direction is still unclear. First of all, it is indicated by a rather long upper shadow of the last candlestick and its closing price is below the blue Kijun line of the Ichimoku indicator, as well as a strong technical level of 0.9200. I assume that the rebound from the highs of the previous week at 0.9230 was also supported by the red Tenkan line and the black exponential moving average, which are slightly above the sellers resistance at 0.9230. However, the current week for the USD/CHF pair started with prevailing bullish sentiment. At the time of writing this article, USD/CHF is trading higher near 0.9205. For this sentiment to persist, upside traders need to close above the previous highs of 0.9230, as well as above the Tenkan and 89 EMA. Only in this case a long-term resistance line is possible at 1.0021-0.9372, and the pair will have a chance to test its breakout. The pair's price movement in the mid-term prospect is likely to be resolved at this point. As for bears on the instrument, they will have to break both of the boundaries of the weekly Ichimoku cloud and then perform a true breakout of the support at 0.9100. Notably, this level is technically quite strong, and only its breakout gives a chance to reach another psychological, historical and technical level of 0.9000.

Daily

This image is no longer relevant

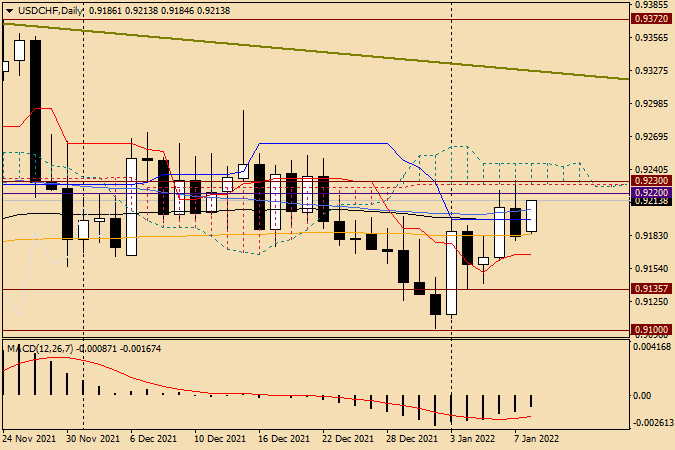
On the daily chart, the pair is near the 50 MA and 200 EMA moving averages, as well as the blue Kijun line of the Ichimoku indicator. Currently, the orange 200 EMA supports the USD/CHF pair and the 50 MA provides resistance. As it is clearly seen in this chart, the lower boundary of the daily cloud interrupted the pair's growth attempts on Friday. Moreover, the resistance was so strong that it fundamentally changed the direction of the price dynamics of this trading instrument. If a candlestick or a combination of bearish reversal candlesticks emerge in the strong technical resistance zone at 0.9200-0.9230, it will be a signal to open trades. I recommend buying after the possible decline of the USD/CHF pair to the red Tenkan line at 0.9166 and below, near support levels of 0.9135 and 0.9100. Bullish candlestick signals at this or at smaller time frames will confirm opening long positions near these levels. Besides, this week one more analysis of the USD/CHF pair will probably be carried out. It will be focused on the smaller time frames, which will likely specify the points for market entry. Currently, according to today's review of the USD/CHF pair, both buying and selling of this pair remain relevant.

Good luck!

Ivan Aleksandrov,
Analytical expert of InstaForex
© 2007-2024
Earn on cryptocurrency rate changes with InstaForex
Download MetaTrader 4 and open your first trade
  • Grand Choice
    Contest by
    InstaForex
    InstaForex always strives to help you
    fulfill your biggest dreams.
    JOIN CONTEST
  • Chancy Deposit
    Deposit your account with $3,000 and get $1000 more!
    In April we raffle $1000 within the Chancy Deposit campaign!
    Get a chance to win by depositing $3,000 to a trading account. Having fulfilled this condition, you become a campaign participant.
    JOIN CONTEST
  • Trade Wise, Win Device
    Top up your account with at least $500, sign up for the contest, and get a chance to win mobile devices.
    JOIN CONTEST
  • 100% Bonus
    Your unique opportunity to get a 100% bonus on your deposit
    GET BONUS
  • 55% Bonus
    Apply for a 55% bonus on your every deposit
    GET BONUS
  • 30% Bonus
    Receive a 30% bonus every time you top up your account
    GET BONUS

Recommended Stories

Can't speak right now?
Ask your question in the chat.
Widget callback