Long-term perspective.
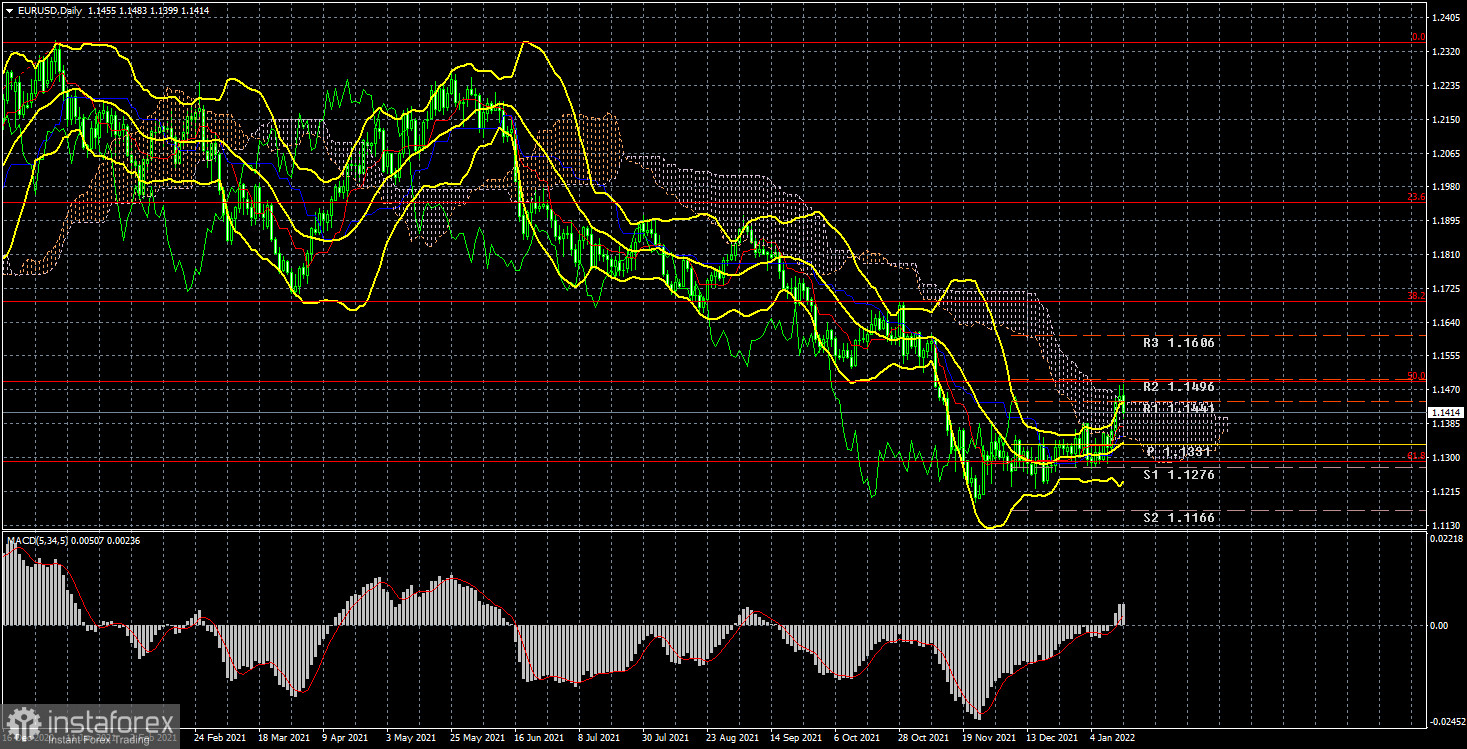
The EUR/USD currency pair has finally left the side channel during the current week after a month and a half of being in the side channel and has grown by about 100 points. Thus, at the moment, it can be concluded that the flat is completed, but the prospects of the European currency remain doubtful. At the moment, the pair has grown to the upper line of the Ichimoku cloud and failed to overcome it, bouncing off it and starting a new round of downward movement on Friday. Thus, the first attempt to start forming a new upward trend failed. We have already said earlier that a lot now depends on whether market participants have played all the factors of the dollar's growth? Recall that the main factor is the tightening of monetary policy in 2022. Traders bought up the dollar in the second half of 2021 based on expectations of the curtailment of the QE program, as well as a rate increase. But the markets are already confident that the program will be completed in March of this year, and the rate will be increased at least 3 times. Thus, these factors may no longer support the dollar. At the same time, the rhetoric of the Fed representatives is tightening every day. Initially, the Fed planned to curtail QE in June 2022, and start raising the rate even later. Now the timing has shifted due to rising inflation. And this factor may again force traders to buy the US dollar since in the European Union there is no talk of raising the rate at all and the maximum that can be counted on is the rejection of the PEPP program this year. Thus, the general fundamental background allows for the continued growth of the US currency. In any case, we do not seriously consider the growth of the euro currency until it is fixed above the Ichimoku cloud.
Analysis of fundamental events.
What can I say about the "foundation" in the reporting week? First, it did not have any impact on the market. Second, if it had, then the dollar would have to grow from Monday to Thursday, and on Friday it would fall. Throughout the week, FOMC members spoke, who made it clear to the market that monetary policy will be tightened as part of the fight against inflation and will do it more quickly and more strongly than previously expected. Thus, the fall of the US currency was not logical, since the tightening factor is a bullish factor for the national currency. Thus, the growth of the pair was exclusively technical. On Friday, the dollar began to rise at night and maintained this trend all day. However, the retail sales report for December in the States completely failed, and Christine Lagarde did not change the nature of her rhetoric by an inch. Therefore, there were no reasons for the dollar to grow on Friday. What is the result? The market is now in a state of search. Bulls could not move the pair up for a month and a half, and bears could not break through the 1.1230 level to continue moving down. As a result, a situation could arise in which traders tried to "take overclocking" before a new attempt to break through the level of 1.1230 while ignoring statistics and the "foundation".
Trading plan for the week of January 17 - 21:
1) On the 24-hour timeframe, the pair tried to start a new upward trend, but the Senkou Span B line could not be overcome. Therefore, a new round of downward movement may begin now and the price may go below 1.1230 in the coming weeks. In any case, it doesn't make sense to talk about serious purchases below Senkou Span B. And sales can be resumed if the pair goes below the critical line. You can also try to sell a pair now but in small lots. Still, the signal of a rebound from the Ichimoku cloud can be considered strong.
2) As for purchases of the euro/dollar pair, in the current conditions, they should be considered no earlier than fixing the price above the Ichimoku cloud, because the price in 2021 overcame the Kijun-sen several times, but then could not continue moving up. There are no fundamental prerequisites for a new upward trend to begin in the near future.
Explanations to the illustrations:
Price levels of support and resistance (resistance /support), Fibonacci levels - target levels when opening purchases or sales. Take Profit levels can be placed near them.
Ichimoku indicators (standard settings), Bollinger Bands (standard settings), MACD (5, 34, 5).
Indicator 1 on the COT charts - the net position size of each category of traders.
Indicator 2 on the COT charts - the net position size for the "Non-commercial" group.