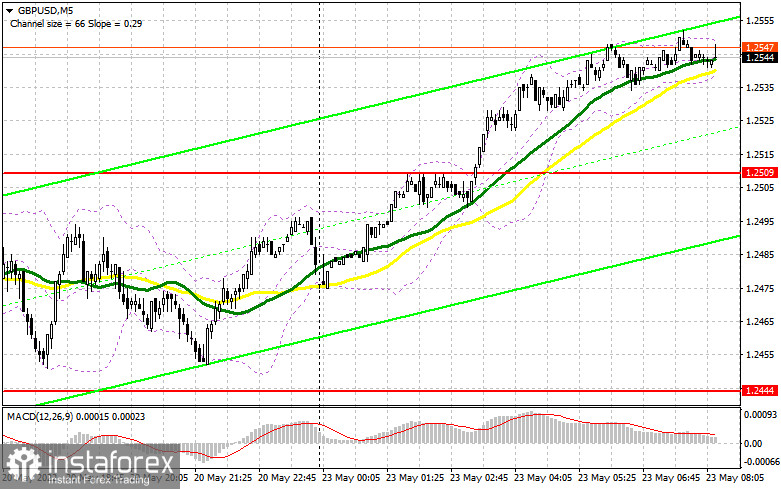
Last Friday, I paid attention to the levels 1.2444 and 1.2509 and advised you to make decisions on entering the market. Let's look at a 5-minute chart and figure out where and how you could and should have entered the market. Given the low volatility during the European session after the release of data on retail sales in the UK and a similar lack of a surge in volume during US trading, it was not possible to reach the levels I indicated. Because of this, I did not see normal signals for entering the market.
When to go long on GBP/USD:
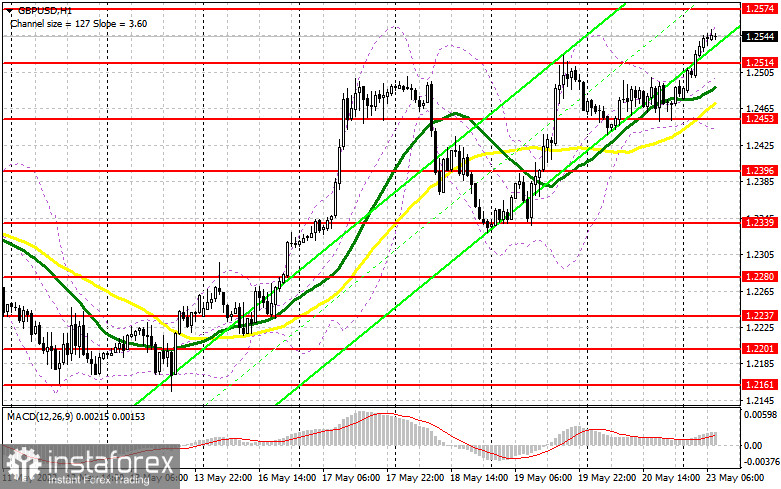
The UK is not expected to release macroeconomic reports today, which should help the bulls in growth in order to build a new upward trend. The breakthrough of 1.2514 during the Asian session allows us to count on the renewal of new local highs, and protecting this range is also an important task in the first half of the day. If the pound does not actively rise in the near future, the bulls will really have to think about defending 1.2514. Below this level are moving averages, playing on their side. Forming a false breakout at 1.2514 will lead to a signal to open new long positions, counting on the continuation of the bull market with growth towards the resistance of 1.2574.
We can expect a sharper rise for the pair, but only after it settles above this range with a reverse test from top to bottom, which may occur during the speech of Bank of England Governor Andrew Bailey. His statements can seriously affect the pair's direction, since a lot will depend on the central bank's policy. Testing the level of 1.2574 will lead to dismantling bears' stop orders and to a more powerful growth of GBP/USD to new weekly highs in the area of 1.2633 and 1.2692, where I recommend taking profits. A more distant target will be the area of 1.2729.
In case the pound falls and bulls are not active at 1.2514, and such a scenario, I think, is more likely, the pressure on the pair will most likely increase sharply. Therefore, I advise you not to rush into long positions. It is best to enter the market after a false breakout in the area of 1.2453. You can buy GBP/USD immediately on a rebound only from the lower border of the channel at 1.2396, or even lower - around 1.2339, counting on correcting 30-35 points within the day.
When to go short on GBP/USD:
Protecting 1.2574 will help the bears return to the market in order to build a downward correction to return the pair to the 1.2514 area. A false breakout at 1.2574 will be an ideal condition for opening short positions in anticipation of settling below 1.2514, which the bears missed during the Asian session. A breakthrough and reverse test from the bottom up of this range creates a signal for short positions, which can quickly return the pound to the low of 1.2453, opening a direct road to 1.2396.
A more distant target will be the area of 1.2339, the test of which will cross out the upward trend in the pair. But hopes that this scenario will come true without good fundamental statistics on the US today are unlikely to succeed. In case GBP/USD grows and traders are not active at 1.2574, another upsurge may occur against the background of stop orders being dismantled. In this case, I advise you to postpone short positions until the next major resistance at 1.2633. I also advise you to open shorts there only in case of a false breakout. You can sell GBP/USD immediately for a rebound from the high of 1.2696, counting on the pair's rebound down by 30-35 points within the day.
COT report:
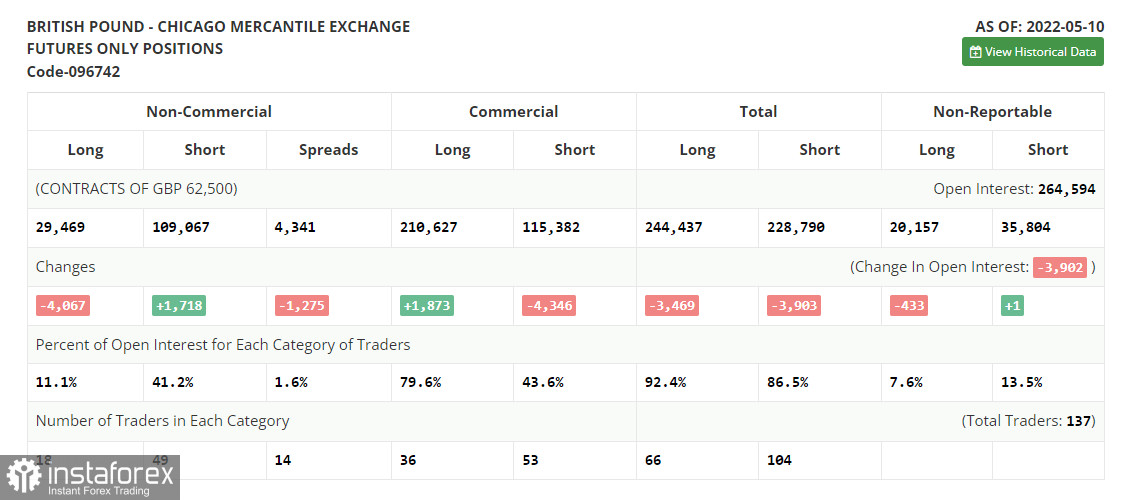
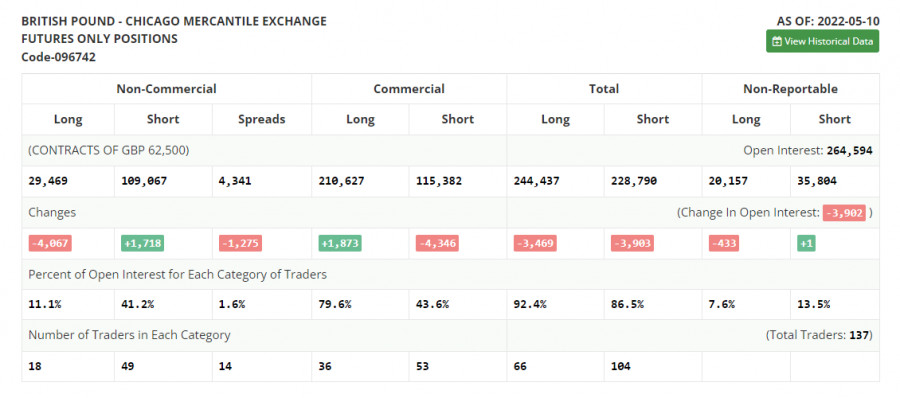
The Commitment of Traders (COT) report for May 10 showed that long positions decreased while short positions had increased, which caused the negative delta to increase further. The presence of a number of problems in the economy and a rather difficult situation with inflation are forcing investors to get rid of the British pound, which is very seriously losing its appeal against the backdrop of demand for safe haven assets and more profitable instruments. The monetary policy of the Federal Reserve, aimed at tightening the cost of borrowing, will continue to support the US dollar, pulling the British pound lower and lower. The actions of the Bank of England to raise interest rates have not yet brought the desired result, and talk that, due to serious economic difficulties, the central bank may even suspend the normalization of monetary policy, scare investors even more. As I have repeatedly noted, future inflationary risks are now quite difficult to assess also because of the difficult geopolitical situation, but it is clear that the consumer price index will continue to rise in the coming months. The situation in the UK labor market, where employers are forced to fight for each employee, offering ever higher wages, is also pushing inflation higher and higher. The May 10 COT report indicated that long non-commercial positions decreased by -4,067 to 29,469, while short non-commercial positions rose by 1,718 to 109,067. This led to an increase in the negative value of the non-commercial net position from - 73,813 to -79,598. The weekly closing price fell from 1.2490 to 1.2313.
Indicator signals:
Moving averages
Trading is conducted above the 30 and 50-day moving averages, which indicates the bulls' attempt to continue the upward trend.
Note: The period and prices of moving averages are considered by the author on the H1 hourly chart and differs from the general definition of the classic daily moving averages on the daily D1 chart.
Bollinger Bands
In case of a decline, the lower border of the indicator around 1.2453 will act as support. In case of growth, the area of 1.2550 will act as resistance.
Description of indicators
- Moving average (moving average, determines the current trend by smoothing out volatility and noise). Period 50. It is marked in yellow on the chart.
- Moving average (moving average, determines the current trend by smoothing out volatility and noise). Period 30. It is marked in green on the chart.
- MACD indicator (Moving Average Convergence/Divergence — convergence/divergence of moving averages) Quick EMA period 12. Slow EMA period to 26. SMA period 9
- Bollinger Bands (Bollinger Bands). Period 20
- Non-commercial speculative traders, such as individual traders, hedge funds, and large institutions that use the futures market for speculative purposes and meet certain requirements.
- Long non-commercial positions represent the total long open position of non-commercial traders.
- Short non-commercial positions represent the total short open position of non-commercial traders.
- Total non-commercial net position is the difference between short and long positions of non-commercial traders.