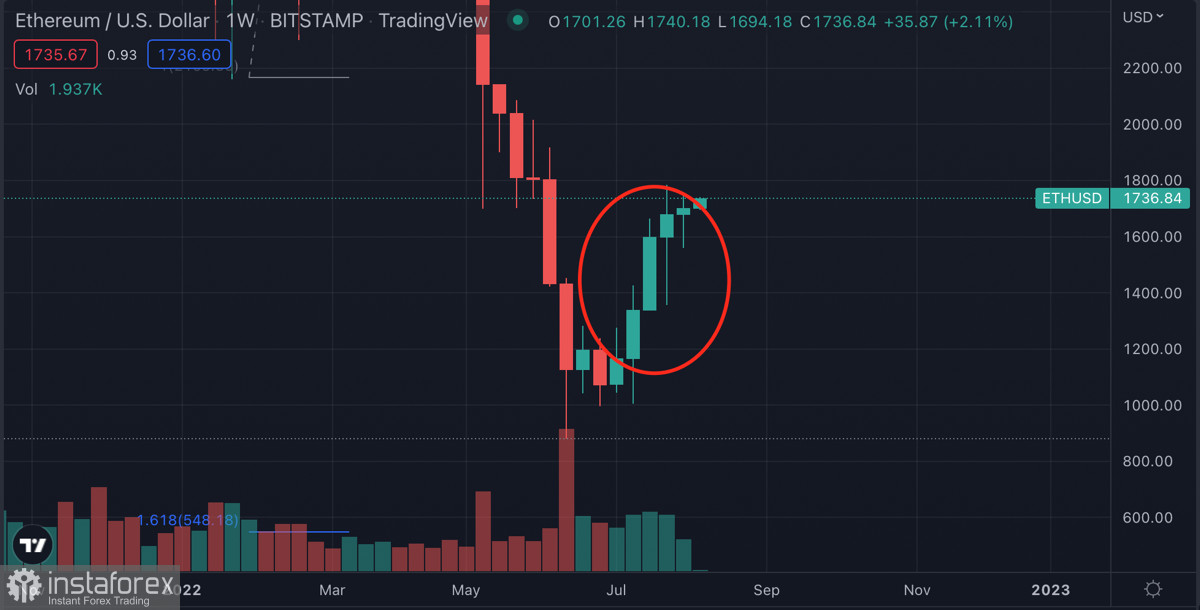
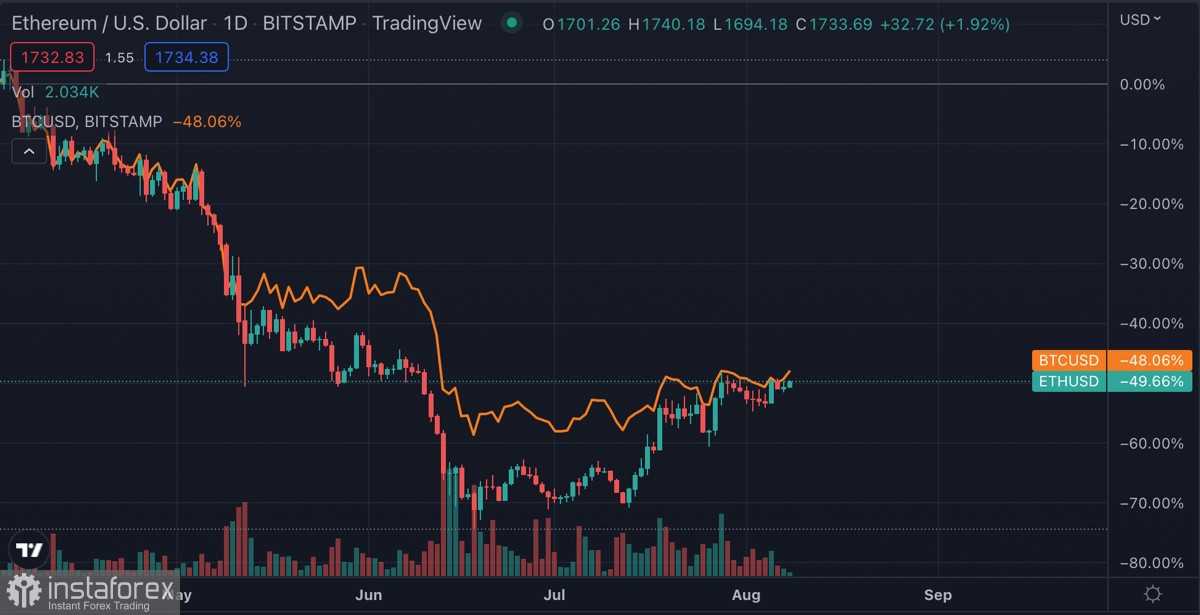
Ethereum remains the main conductor of liquidity in the cryptocurrency market. Unlike Bitcoin, Ethereum has been showing a steady upward movement that has been going on for five weeks in a row. At the same time, it is important to note that over the past three weeks, a negative downward trend in buying activity has formed. This is displayed on the body of a bullish candle, which closed at parity between buyers and sellers between August 1 and 7. It is likely that after a period of a long upward movement, the asset will need a correction.
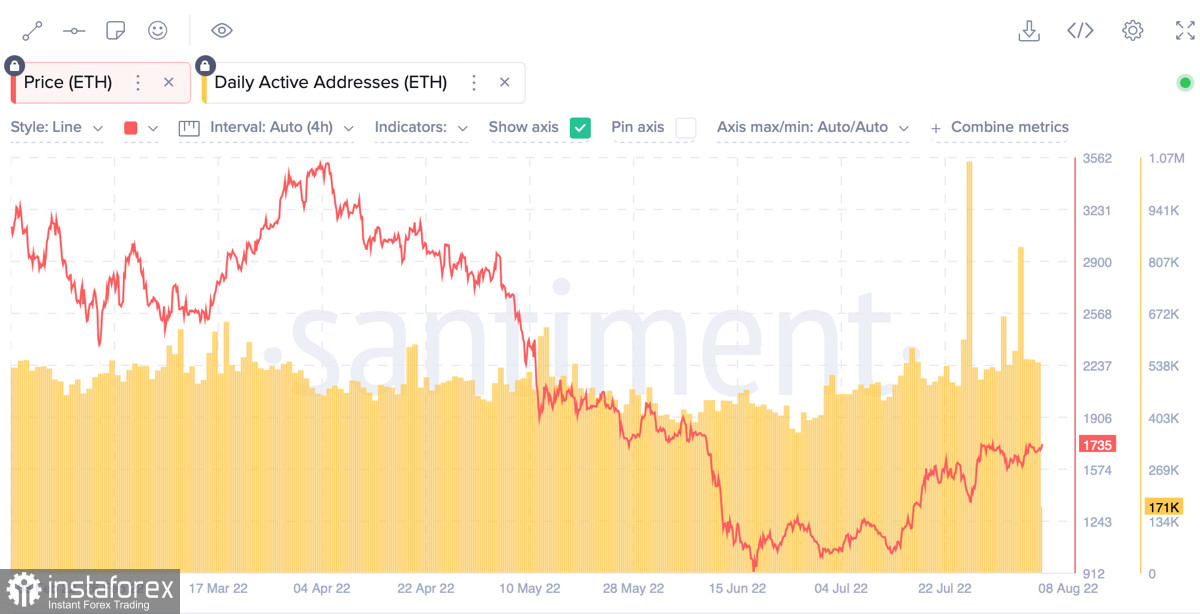
Unlike the situation with BTC, Ethereum's on-chain metrics point to a strong upward trend foundation. The number of unique addresses in the asset network continues to grow, and the fall over the weekend was not significant. This suggests that retail investors are actively participating in trading on the ETH network. This is partly due to the general hype around the coin, but to a greater extent, it is the merit of the fallen commissions in the cryptocurrency network.
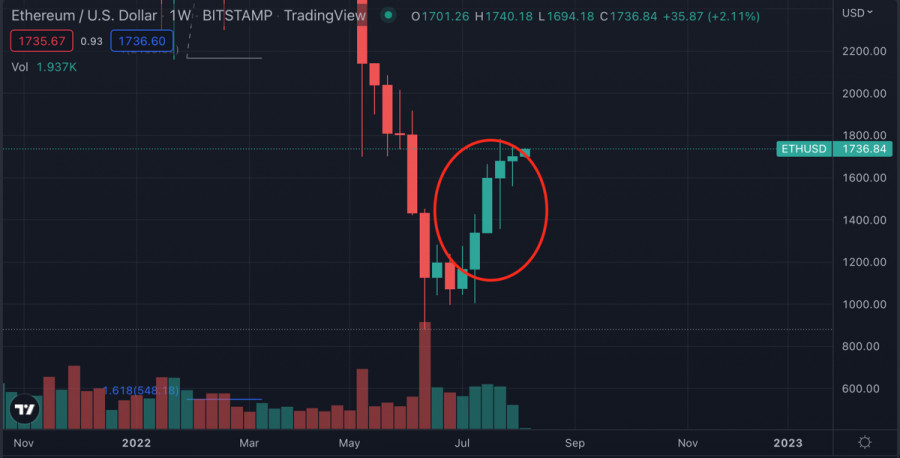
The main difference between ETH on-chain metrics and BTC metrics is that the trading activity in the network of the main altcoin remains at a high level. The growing number of unique addresses in the cryptocurrency network is underpinned by a steady increase in intraday trading volumes. Therefore, the upward trend of the ether is more stable and justified. This is exactly what we see on the weekly timeframe, where the price has been continuously rising for five weeks.
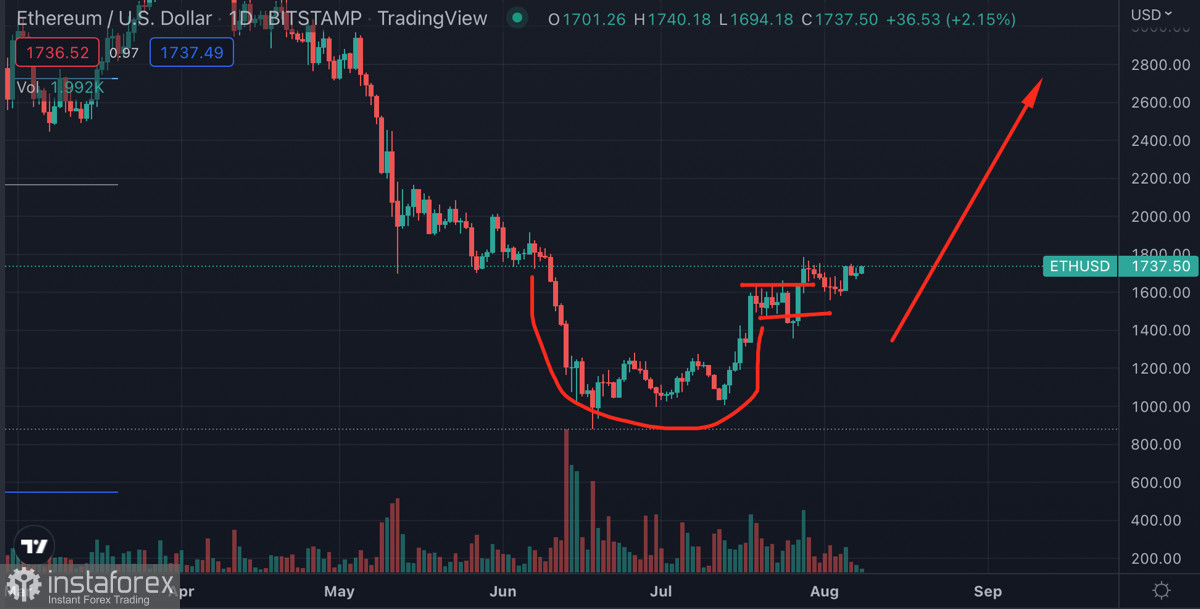
Another important signal for the continuation of the upward movement of Ethereum is the completion of the "cup and handle" pattern. The asset managed to break through the $1700 level and thus complete the formation of the pattern. If the current market situation persists, the potential for the upward movement of Ethereum reaches the level of $2800. However, there is a possibility that before the pattern is realized, ETH/USD will go to a local correction.
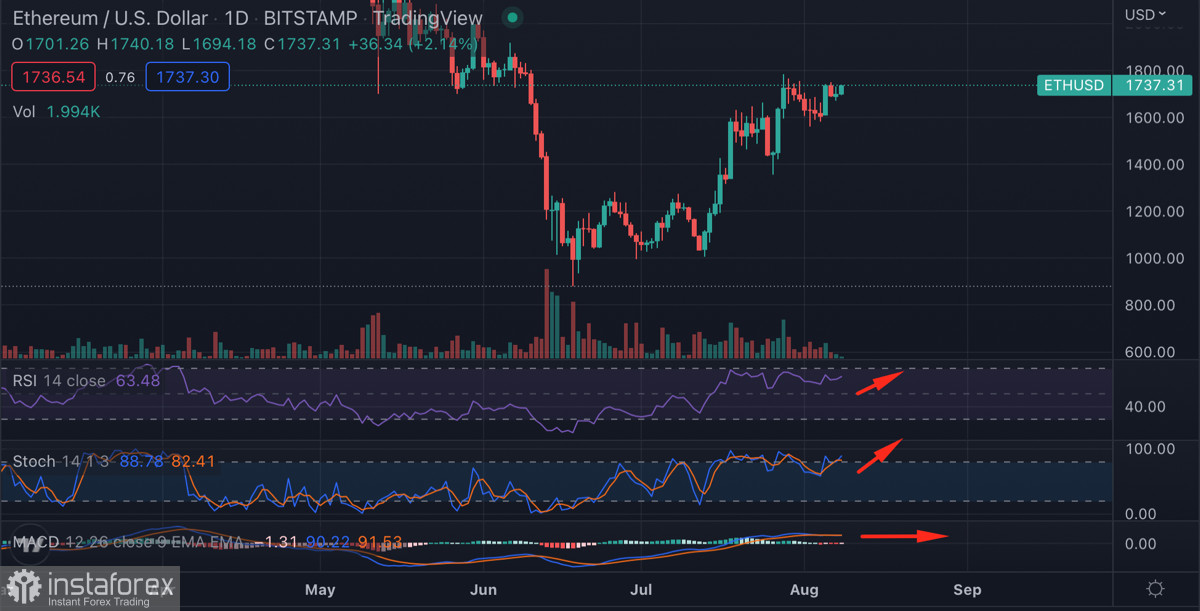
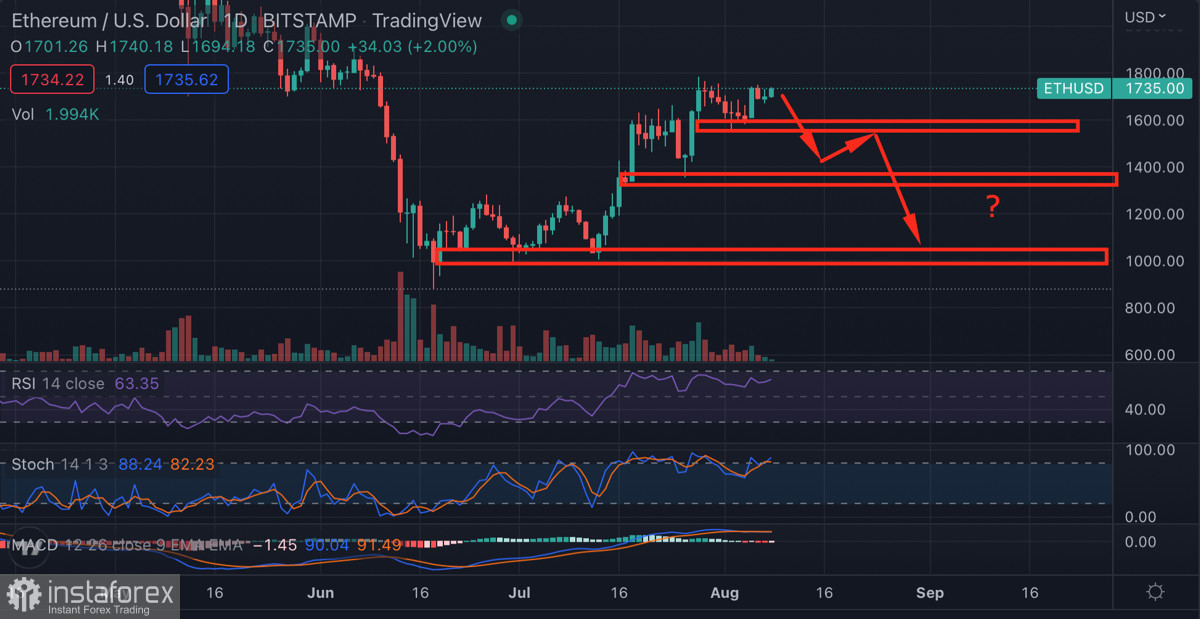
If you look at the technical indicators of the cryptocurrency on the daily chart, you can see that dangerous borders are being reached. The RSI index ended the previous trading week above the level of 60 and continues its upward movement. The stochastic oscillator reached 80 in the previous week. As of August 8, the metric formed another bullish crossover above 80, which is a sign of overheating of the Ethereum market.
Given the readings of the main metrics, we can conclude that the asset has reached or is approaching the overbought state. This usually happens when the metrics are above 80. However, in the case of Ethereum, it is also important to consider the asset's significantly increased inflation rate due to the influx of users and low transaction fees.
Considering the options for a possible correction in ETH/USD, several targets need to be identified. The first target is located at the level of $1600, and taking into account the minimum amount of time that the asset spent here, this milestone will be broken. The next target is the range of $1400–$1450, and judging by the long period of consolidation, this is where the main stage of the correction will end.
However, it is important to take into account external factors, including the dynamics of the movement of BTC, stock indices, and macroeconomic events. Taking this into account, it is not possible to suggest a probable level of completion of the correction. But there is no doubt that the ether needs a pause to maintain the current trend.