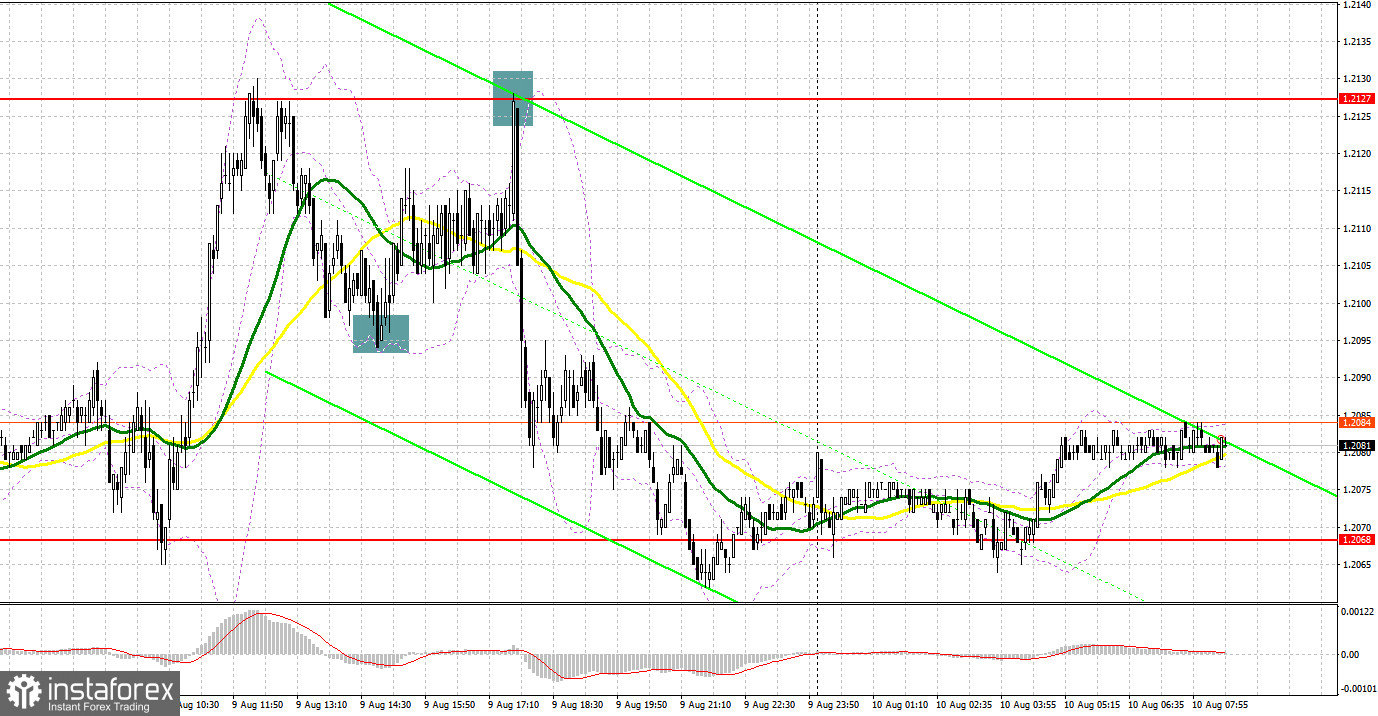
Several excellent market entry signals were formed yesterday. Let's take a look at the 5-minute chart and see what happened. I paid attention to the 1.2096 level in my morning forecast and advised making decisions from it. Pound bulls managed to settle above 1.2096, and the reverse test of this range from top to bottom resulted in creating a signal to open long positions. As a result, the pair rose by more than 30 points and hit the daily high. A false breakout at 1.2127 in the afternoon resulted in a sell signal for the pound, resulting in a drop of over 40 points.
When to go long on GBP/USD:
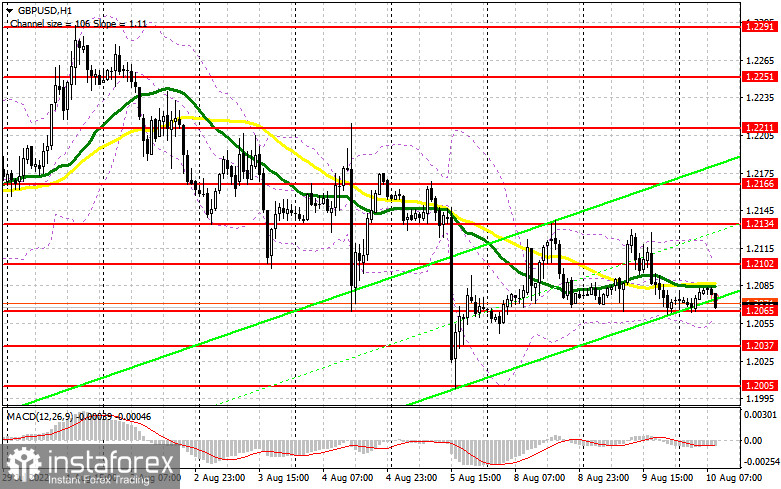
The pound remains within the horizontal channel formed at the beginning of this week and is likely to come out of it only after today's US inflation data is released, which many traders will rely on. If inflation continues to rise, the demand for the dollar will certainly increase, and we will see the pair move down. If inflation shows the first decline in such a long time, then most likely the pound will strengthen its position and the bulls will have to fight for the upper boundary of the horizontal channel. If the pair goes down in the first half of the day, the best scenario for buying will be a false breakout near the lower border of the horizontal channel and the nearest support at 1.2065, formed at the beginning of this week. In this case, you can count on a new GBP/USD upsurge to 1.2102, getting above which you can talk about updating 1.2134. A breakthrough of this range will turn the market over and will witness the formation of a new upward trend with an update of a more distant target at 1.2166, where I recommend taking profits.
If GBP/USD falls and there are no bulls at 1.2065, the pressure on the pound will increase again, which will return the advantage to the bears who have been holding the market under their control since the beginning of this month. In this case, I recommend postponing long positions to 1.2037 - an intermediate support formed on the basis of last Friday. I advise you to buy there only on a false breakout. You can open long positions on GBP/USD immediately for a rebound from 1.2005, or even lower - in the area of 1.1964, counting on correcting 30-35 points within the day.
When to go short on GBP/USD:
Bears will wait for the US inflation report and act based on it. Of course, an attempt to break through 1.2065 may be made in the first half of the day, but it is unlikely that we will see a serious fall of the pair below this level. The best option would be short positions on the pound's growth from the middle of the horizontal channel at 1.2102. Forming a false breakout there will provide a good entry point with the goal of moving to the nearest support at 1.2065. Given that there is no important data for the UK today, it is unlikely that it will be possible to break below this range without problems. Only a breakthrough and reverse test from below 1.2065 will provide an entry point for selling with a fall to 1.2037, and the area of 1.2005 will be a further target, where I recommend taking profits. We will be able to achieve a renewal of monthly lows around 1.1964 only with another spurt in inflationary pressure in the US in the second half of the day.
In case GBP/USD grows and there are no bears at 1.2102, bulls will have an excellent chance of returning to 1.2134, which will make life difficult for the pound bears. Only a false breakout around 1.2134 would provide an entry point to short positions in anticipation of a downward movement. If traders are not active there as well, a surge up to the high of 1.2166 may occur. There, I advise you to sell GBP/USD immediately for a rebound, based on a rebound of the pair down by 30-35 points within the day.
COT report:
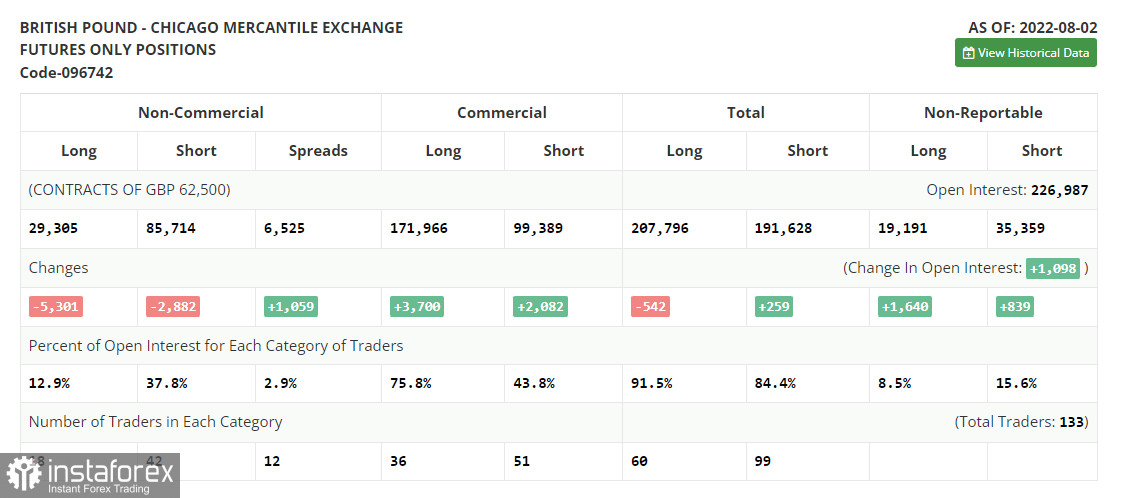
According to the Commitment of Traders (COT) report from August 2, the number of both short and long positions declined. However, the number of long positions showed a more significant drop, reflecting traders' concern about the current economic situation in the UK and Bank of England's aggressive policy. Last week, the regulator raised the benchmark rate by 0.5 basis points. This was the sharpest rise in the last 27 years. It is obvious that the central bank is ready to affect the economic growth pace, which is rapidly dropping, to cope with the record high inflation. By October of this year, inflation may reach 13.0%, according to official forecasts. Even under the current conditions, traders of the pound sterling should not lose hope since the currency is greatly oversold against the US dollar. If in the near future, the US inflation data surprises investors, the pound/dollar pair may resume rising. The COT report unveiled that the number of long non-commercial positions decreased by 5,301 to 29,305, while the number of short non-commercial positions slid by 2,882 to 85,714, which led to an increase in the negative value of the non-commercial net position to the level of -56,409 from -53,990. The weekly closing price rose to 1.2180 against 1.2043.
I recommend to read:
Indicator signals:
Moving averages
Trading is carried out in the area of 30 and 50-day moving averages, which indicates the sideways nature of the market.
Note: The period and prices of moving averages are considered by the author on the H1 hourly chart and differs from the general definition of the classic daily moving averages on the daily D1 chart.
Bollinger Bands
In case of growth, the area of 1.2102 will act as resistance. If the pair goes down, the lower border of the indicator around 1.2055 will act as support.
Description of indicators
- Moving average (moving average, determines the current trend by smoothing out volatility and noise). Period 50. It is marked in yellow on the chart.
- Moving average (moving average, determines the current trend by smoothing out volatility and noise). Period 30. It is marked in green on the chart.
- MACD indicator (Moving Average Convergence/Divergence — convergence/divergence of moving averages) Quick EMA period 12. Slow EMA period to 26. SMA period 9
- Bollinger Bands (Bollinger Bands). Period 20
- Non-commercial speculative traders, such as individual traders, hedge funds, and large institutions that use the futures market for speculative purposes and meet certain requirements.
- Long non-commercial positions represent the total long open position of non-commercial traders.
- Short non-commercial positions represent the total short open position of non-commercial traders.
- Total non-commercial net position is the difference between short and long positions of non-commercial traders.