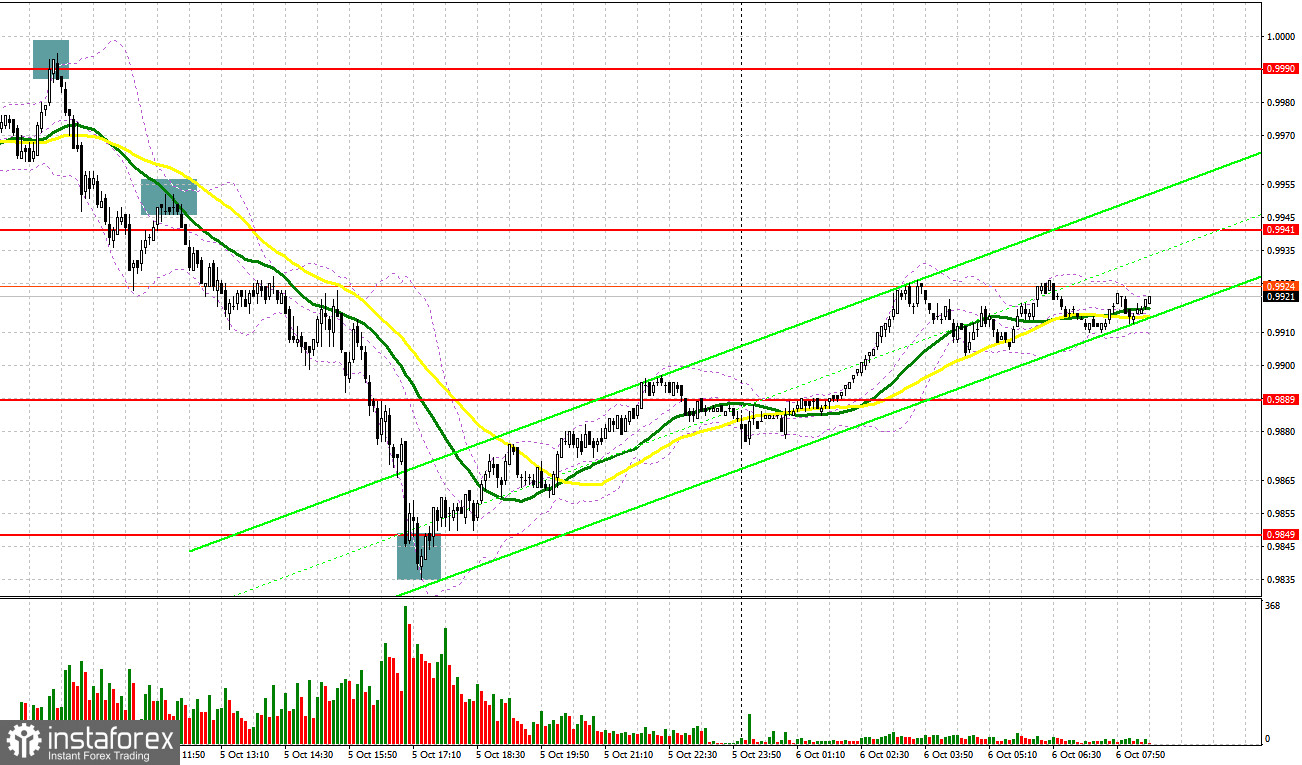
Yesterday, traders received several signals to enter the market. Let us focus on the 5-minute chart to clear up the market situation. Earlier, I asked you to pay attention to the levels of 0.9996 and 0.9952 to decide when to enter the market. The euro increased at the beginning of the European session. A false breakout of 0.9996 gave a sell signal, which brought about 40 pips of income. Even if traders failed to enter the market at 0.9996, the next breakout and a reverse test of 0.9952 amid weak PMI data from the eurozone gave another sell signal. As a result, the euro slid by more than 40 pips. In the second part of the day, only a false breakout near the low of 0.9849 gave a buy signal, which led to a rise of 45 pips.
Conditions for opening long positions on EUR/USD:
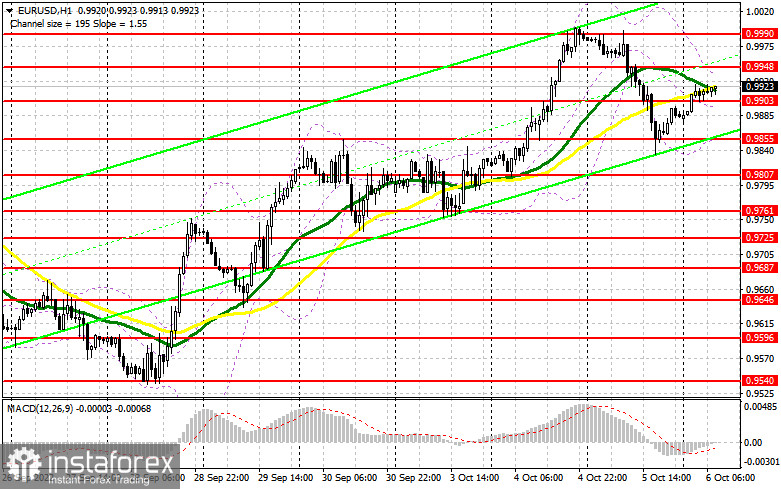
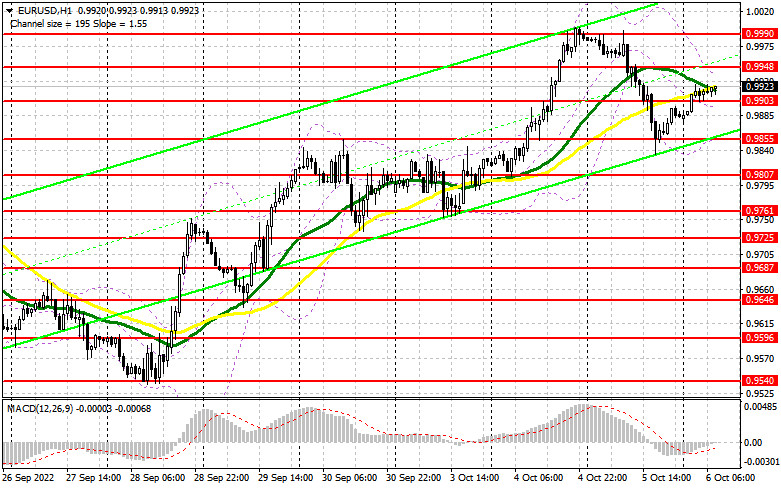
The US strong data, especially on the labor market, spurred a rapid downward correction in the euro and a rise in the US dollar. However, technical principles allowed bulls to recoup some of their losses. Nevertheless, they do not have control over the market now. Traders are likely to price in tomorrow's data on the APD non-farm employment change for September. The fact is that this report may significantly alter the market situation. Today, in the first part of the day, Germany will disclose its factory orders figures, whereas the eurozone will publish its retail sales report for August. Notably, this information will hardly affect the market. All eyes will be turned to the report on the ECB meeting, which took place last month. Although the ECB has chosen a clear stance, which presupposes a further rise in interest rates, it will be interesting to learn about the meeting itself. If traders react negatively to the new information and the pair declines, it will be better to go long from 0.9903. A false breakout of this level will boost the volume of long positions, allowing the price to jump to the high of 0.9948. A breakout and a downward test of this level as well as strong data from the eurozone will affect bears' stop orders, thus forming an additional long signal with the target at 0.9990. If the price settles above this level, it will resume the uptrend. The next target is located at the resistance level of 1.0040, where it is recommended to lock in profits. If the euro/dollar pair declines and buyers fail to protect 0.9903, pressure on the euro will increase, thus offsetting yesterday's bulls' attempts to regain control over the market. In this case, the pair may drop to 0.9855. It will be wise to open buy positions after a false breakout of this level. Traders may also go long just after a bounce off 0.9807 or lower - from 0.9761, expecting an upward correction of 30-35 pips.
Conditions for opening short positions on EUR/USD:
Bears took some confident steps and now they should primarily protect the nearest resistance level of 0.9948. Weak data from the eurozone will encourage sellers. A false breakout of this level will give a perfect sell signal, allowing the pair to drop to 0.9903, an intermediate support level formed yesterday. A breakout and settlement below this level as well as an upward test will give an additional sell signal, which will affect buyers' stop orders. In this case, the pair may tumble to 0.9855. Yesterday, the price rebounded from this level. The next target is located at 0.9807, where it is recommended to lock in profits. If the euro increases during the European session and bears fail to protect 0.9948, demand for the asset will surge, thus boosting the price. Under these conditions, traders should open short positions after a false breakout of 0.9990. It is also possible to go short just after a rebound from the high of 1.0040 or even higher – from 1.0084, expecting a decline of 30-35 pips.
COT report
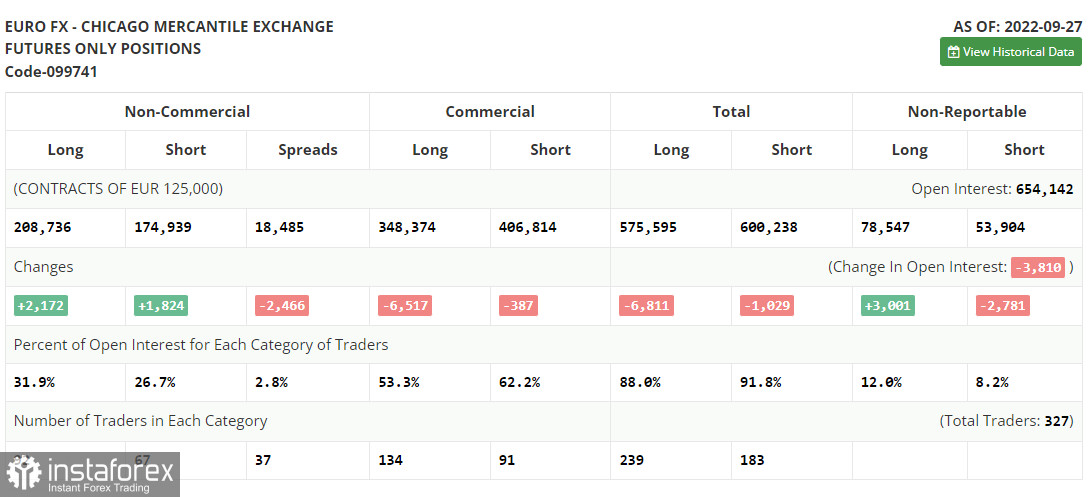
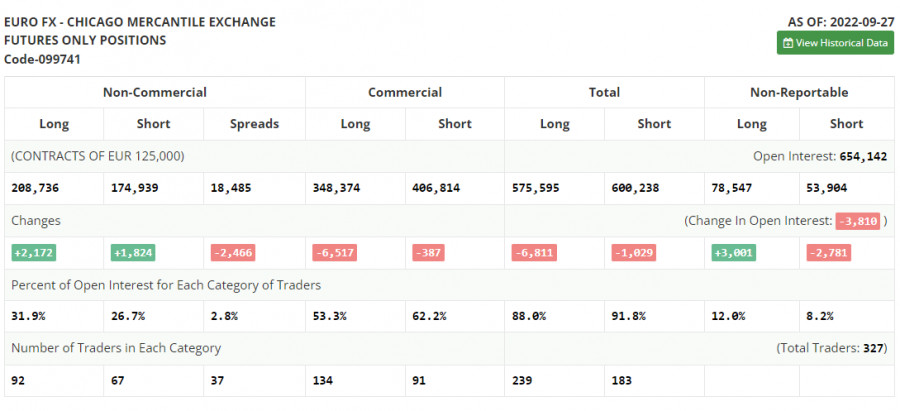
According to the COT report from September 27, the number of both short and long positions increased. After the central banks' meetings, the euro was under considerable pressure caused by comments provided by European and US politicians. However, the currency managed to cope with it and now it has every chance to cover, though for a short period of time. The fact is that inflation in the EU has already exceeded 10.0%. In autumn and winter, the situation will only aggravate. That is why the euro will hardly show considerable growth. The worsening geopolitical situation in the world, which is mainly affecting the eurozone, may cause a considerable slowdown in the local economy, which is likely to slip into recession as early as next spring. Soon, the eurozone will disclose reports on activity in various sectors. A decline may cap the pair's upward potential. The COT report unveiled that the number of long non-commercial positions increased by 2,172 to 208,736, whereas the number of short non-commercial positions surged by 1,824 to 174,939. At the end of the week, the total non-commercial net position remained positive and amounted to 33,797 against 33,449. This indicates that investors are taking advantage of the moment and continue to buy the cheap euro below parity, as well as accumulate long positions, expecting the end of the crisis and the pair's recovery in the long term. The weekly closing price collapsed to 0.9657 from 1.0035.
Signals of indicators:
Moving Averages
Trading is performed below the 30- and 50-day moving averages, which points to bears' attempts to return to the market.
Note: The period and prices of moving averages are considered by the author on the one-hour chart, which differs from the general definition of the classic daily moving averages on the daily chart.
Bollinger Bands
If the pair advances, the upper limit of the indicator located at 0.9950 will act as resistance.
Description of indicators
- Moving average (moving average, determines the current trend by smoothing volatility and noise). The period is 50. It is marked in yellow on the chart.
- Moving average (moving average, determines the current trend by smoothing volatility and noise). The period is 30. It is marked in green on the graph.
- MACD indicator (Moving Average Convergence/Divergence - convergence/divergence of moving averages). A fast EMA period is 12. A slow EMA period is 26. The SMA period is 9.
- Bollinger Bands. The period is 20.
- Non-profit speculative traders are individual traders, hedge funds, and large institutions that use the futures market for speculative purposes and meet certain requirements.
- Long non-commercial positions are the total number of long positions opened by non-commercial traders.
- Short non-commercial positions are the total number of short positions opened by non-commercial traders.
- The total non-commercial net position is a difference in the number of short and long positions opened by non-commercial traders.