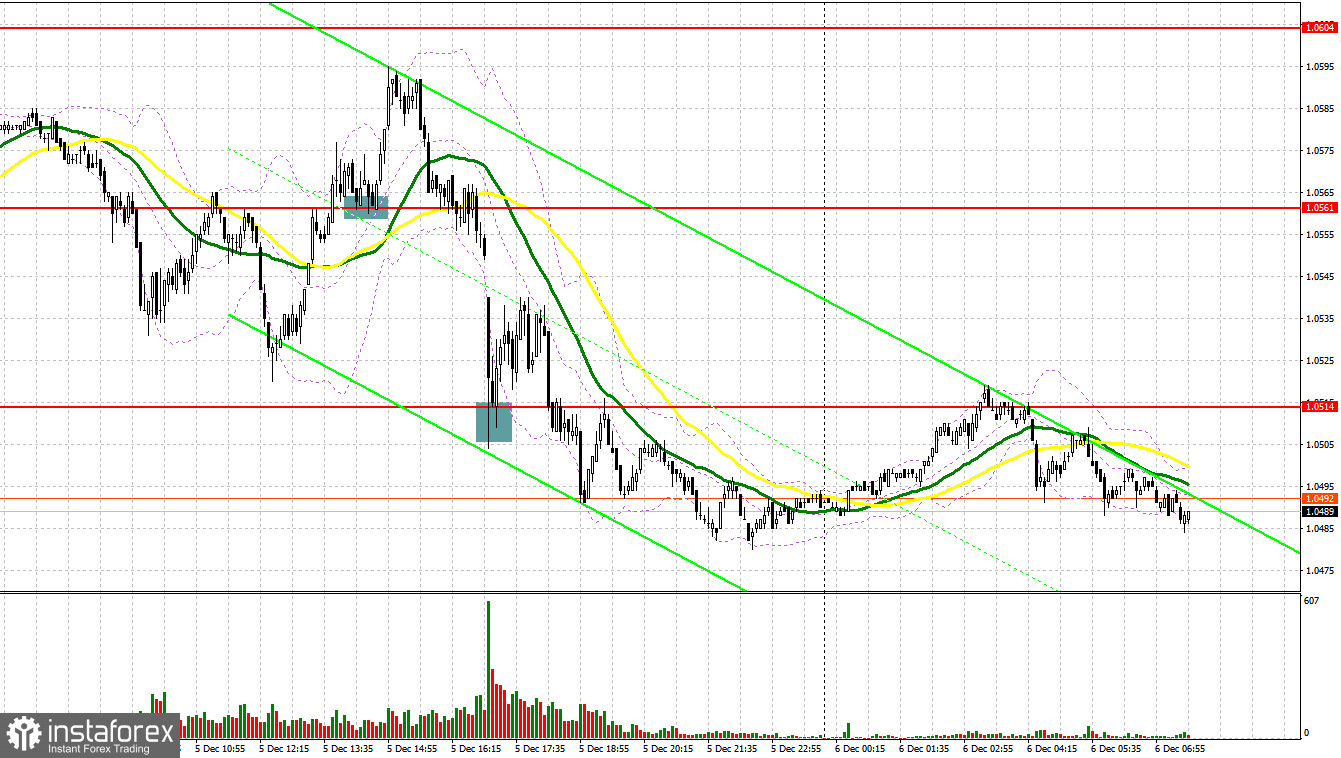
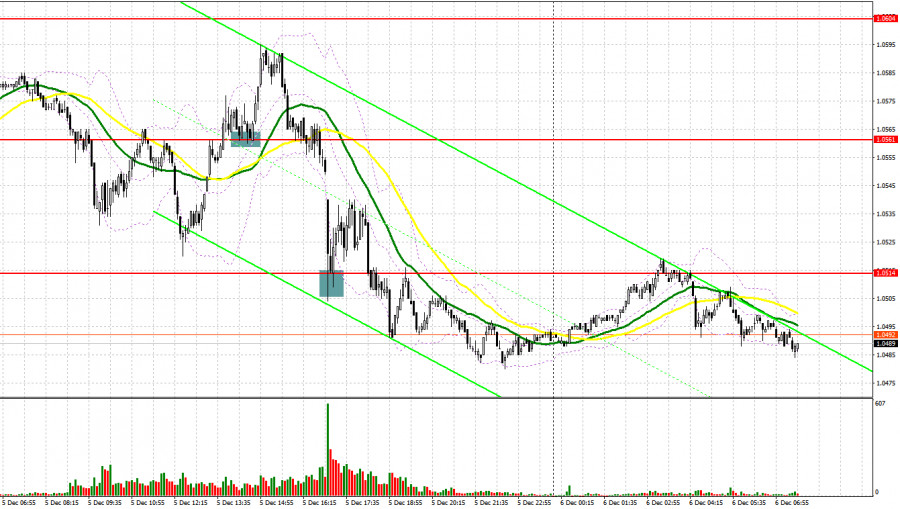
Yesterday, traders received several perfect signals to enter the market. Let us take a look at the 5-minute chart to clear up the market situation. Earlier, I asked you to pay attention to the level of 1.0537 to decide when to enter the market. The pair dropped amid weak PMI data. However, buyers managed to protect the support level of 1.0532. A false breakout of this level gave a buy signal, which allowed the pair to continue an uptrend. The pair rose by 30 pips, but, later, pressure on the pair returned. In the second part of the day, bulls regained control over the resistance level of 1.0561, whereas an upward test of this level gave a buy signal. As a result, the pair climbed by 30 pips. The same situation took place from the level of 1.0514.
Conditions for opening long positions on EUR/USD:
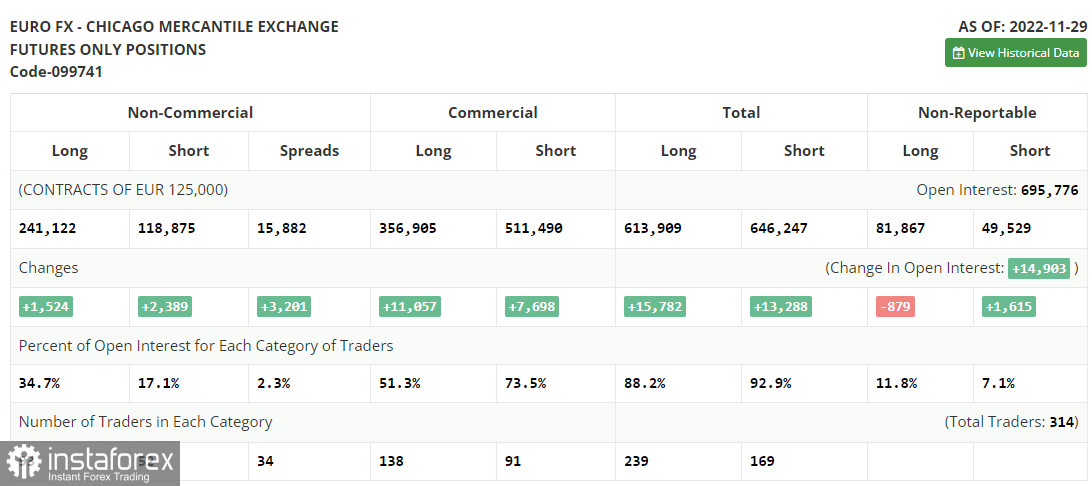
First of all, let us focus on the futures market and the COT report. According to the COT report from November 29, the number of both long and short positions increased. Announcements made by Jerome Powell last week retained demand for risk assets, including the euro. Since the pair has been confidently rising since November, there are a lot of traders who prefer selling at the current levels. Recent fundamental data from the US, namely, business activity and labor market indicators, allowed traders to bet on a longer period of higher interest rates in the US in the upcoming year. Against the backdrop, there is no good reason to open long positions in the mid term. The higher the euro climbs, the deeper it will fall. The week is expected to be calm and traders are likely to shift their attention to the FOMC meeting, which is scheduled for December 13-14. According to the COT report, the number of long non-commercial positions increased by 1,524 to 241,122, whereas the number of short non-commercial positions jumped by 2,389 to 118,875. At the end of the week, the total non-commercial net position decreased slightly to 122,234 from 123,112. This indicates that investors are no longer in such a hurry to buy back the euro since it is not as cheap as it was a few months earlier. The weekly closing price advanced to 1.0342 from 1.0315.
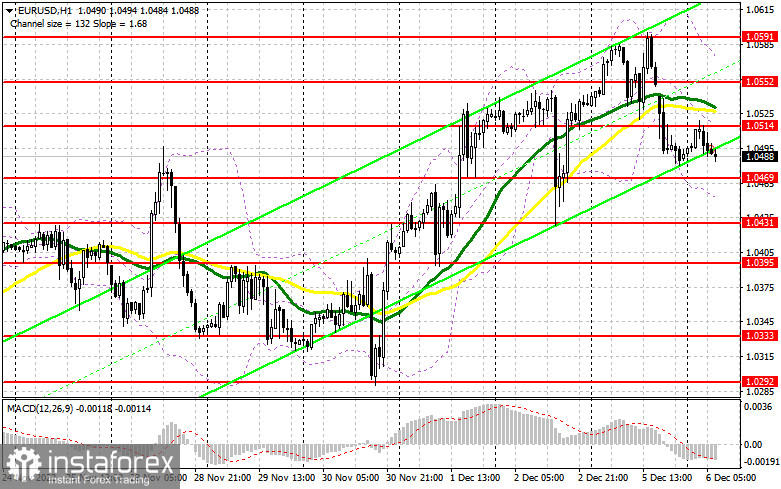
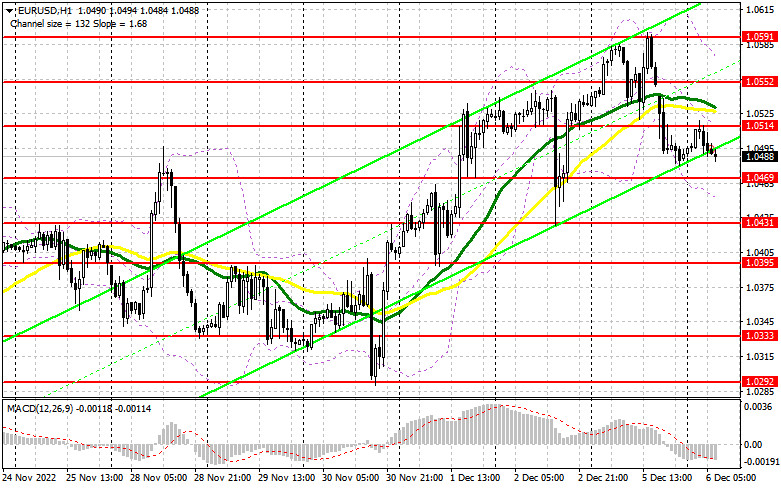
Strong data on the US services PMI, which continued rising faster than expected, boosted demand for the greenback. Now, the currency has every chance to correct against the euro, especially if the Fed remains silent ahead of the meeting. Early today, traders will be focused on Germany's factory orders and the eurozone construction PMI. If the data is disappointing, pressure on the euro will mount. In this light, the pair may show a deeper correction. If the pair declines, only a false breakout of 1.0469 will give a long signal with the target above the nearest resistance level of 1.0514, where there are bearish MAs. A breakout and a downward test of this level amid strong data from the eurozone will allow the pair to climb to the high near 1.0552. In this case, the price may grow even more to 1.0591. The farthest target is located at 1.0604. In the pair touches this level, the uptrend is likely to continue. Traders are better to lock in profits at this level. If the euro/dollar pair declines and buyers fail to protect 1.046, they may lose control over the market. Only a false breakout of the next support level will give a buy signal. Traders may also go long just after a bounce off the support level at 1.0395 or even lower – from the low of 1.0333, expecting an increase of 30-35 pips.
Conditions for opening short positions on EUR/USD:
Sellers remain active and expect a more considerable decline, which may take place amid weak data from the eurozone. What is more, a smaller appetite for risk assets caused by the expectations of aggressive measures by the Fed may also lead to a drop in the euro. Today, it will be wise to sell the euro after a false breakout of the nearest resistance level of 1.0514, which was formed yesterday. A failure to consolidate at this level will lead to a decrease to 1.0469. A breakout and settlement below this area as well as an upward test will form an additional sell signal, which will affect buyers' stop orders and spur a decline to 1.0431, where it is recommended to lock in profits. The pair may slide deeper only amid positive data from the US. If the euro/dollar pair advances during the European session and bears fail to protect 1.0514, the pair may jump. In the event of this, traders should avoid selling the asset until the price hits 1.0552. A false breakout of this level will allow traders to open short orders. It is also possible to go short just after a rebound from 1.0591, the high of this month, or even higher – from 1.0640, expecting a decline of 30-35 pips.
Signals of indicators:
Moving Averages
Trading is performed below 30- and 50-day moving averages, which points to a drop in the euro.
Note: The period and prices of moving averages are considered by the author on the one-hour chart which differs from the general definition of the classic daily moving averages on the daily chart.
Bollinger Bands
In case of a decline, the lower limit of the indicator located at 1.0450 will act as support. If the pair advances, a resistance level could be seen at 1.0570, the upper limit of the indicator.
Description of indicators
- Moving average (moving average, determines the current trend by smoothing volatility and noise). The period is 50. It is marked in yellow on the chart.
- Moving average (moving average, determines the current trend by smoothing volatility and noise). The period is 30. It is marked in green on the graph.
- MACD indicator (Moving Average Convergence/Divergence - convergence/divergence of moving averages). A fast EMA period is 12. A slow EMA period is 26. The SMA period is 9.
- Bollinger Bands. The period is 20.
- Non-profit speculative traders are individual traders, hedge funds, and large institutions that use the futures market for speculative purposes and meet certain requirements.
- Long non-commercial positions are the total number of long positions opened by non-commercial traders.
- Short non-commercial positions are the total number of short positions opened by non-commercial traders.
- The total non-commercial net position is a difference in the number of short and long positions opened by non-commercial traders.