empty
 
 
30.01.2023 11:26 AM
Technical analysis of EUR/USD and GBP/USD on January 30, 2023

EUR/USD

This image is no longer relevant

Higher time frames

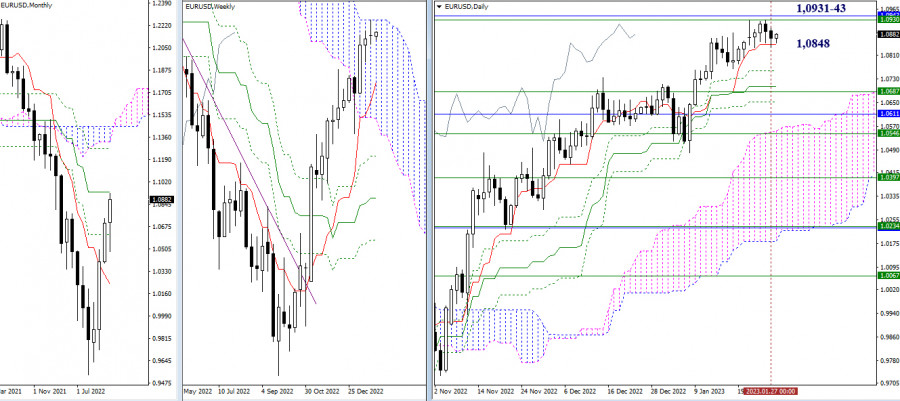
Last week, the pair traded in the 1.0931-43 resistance range, represented by the upper limit of a one-week cloud and a one-month medium-term trend. Support stood at the intraday short-term trend line of 1.0848. Currently, the price is seen to be in the 1.0931-43 – 1.0848 range. A breakout and consolidation beyond the limits may change the price movement. The upward target is seen at a monthly high of 1.1274. Meanwhile, the bears may attempt to test the barrier and perhaps liquidate the daily Ichimoku cross marked by levels 1.0759 – 1.0706 – 1.0653 and strengthened by the weekly short-term trend line of 1.0687.

This image is no longer relevant

H4 – H1

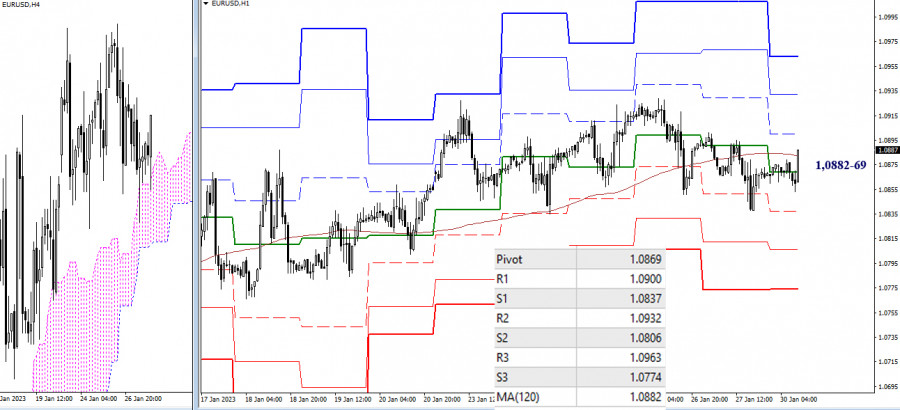
Lower time frames illustrate market uncertainty. Key levels are seen at 1.0882-69 (central pivot level + one-week long-term trend line). The pair has long been hovering near them. The bears may benefit from the fact that the price is below the key levels. If the market is bearish intraday, the pair may find support near classic pivot support at 1.0837 – 1.0806 – 1.0774. If the bulls consolidate above the key levels (1.0882-69) and push the price further up, the focus will be on classic pivot resistance at 1.0900 – 1.0932 – 1.0969.

***

GBP/USD

This image is no longer relevant

Higher time frames

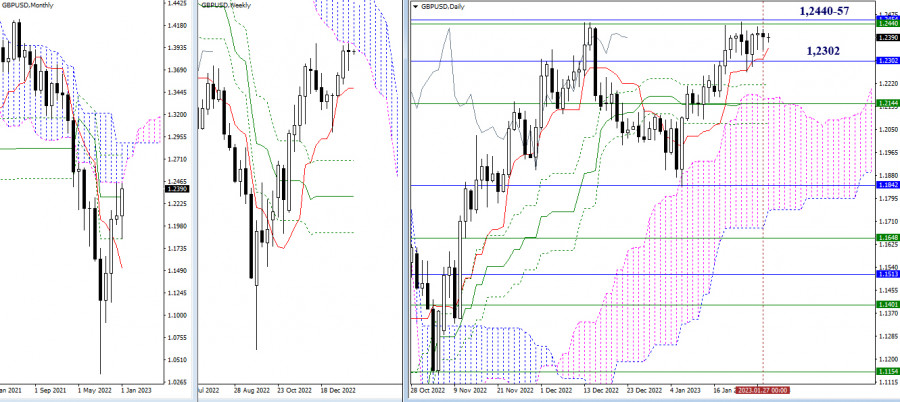
Last week, the pair traded between the 1.2457-40 resistance range (upper limits of the Ichimoku cloud of one-month and one-week time frames) and 1.2302 support (one-month medium-term trend line + intraday short-term trend line). Today, the intraday short-term trend line is seen at 1.2350. Uncertainty is still felt across the market. If the price leaves the limits of the range, we will see the beginning of a new trend.

This image is no longer relevant

H4 – H1

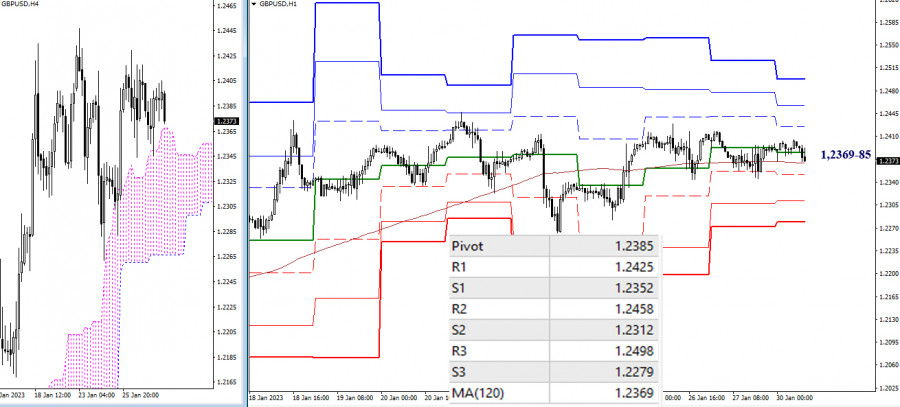
The key levels of lower time frames at 1.2369-85 (central pivot level + one-week long-term trend line) are almost horizontal. They have been weighing on the pair for a long time. Those market players who are in control of key levels usually have more benefits. Resistance at 1.2425 – 1.2458 – 1.2498 and classic pivot support at 1.2352 – 1.2312 – 1.2279 serve as intraday targets.

***

Indicators used in technical analysis:

Higher time frames - Ichimoku Kinko Hyo (9.26.52) + Fibo Kijun levels

H1 – classic pivot points + 120-period Moving Average (weekly long-term trendline)

Evangelos Poulakis,
Analytical expert of InstaForex
© 2007-2024
Earn on cryptocurrency rate changes with InstaForex
Download MetaTrader 4 and open your first trade
  • Grand Choice
    Contest by
    InstaForex
    InstaForex always strives to help you
    fulfill your biggest dreams.
    JOIN CONTEST
  • Chancy Deposit
    Deposit your account with $3,000 and get $1000 more!
    In April we raffle $1000 within the Chancy Deposit campaign!
    Get a chance to win by depositing $3,000 to a trading account. Having fulfilled this condition, you become a campaign participant.
    JOIN CONTEST
  • Trade Wise, Win Device
    Top up your account with at least $500, sign up for the contest, and get a chance to win mobile devices.
    JOIN CONTEST
  • 100% Bonus
    Your unique opportunity to get a 100% bonus on your deposit
    GET BONUS
  • 55% Bonus
    Apply for a 55% bonus on your every deposit
    GET BONUS
  • 30% Bonus
    Receive a 30% bonus every time you top up your account
    GET BONUS

Recommended Stories

Can't speak right now?
Ask your question in the chat.
Widget callback