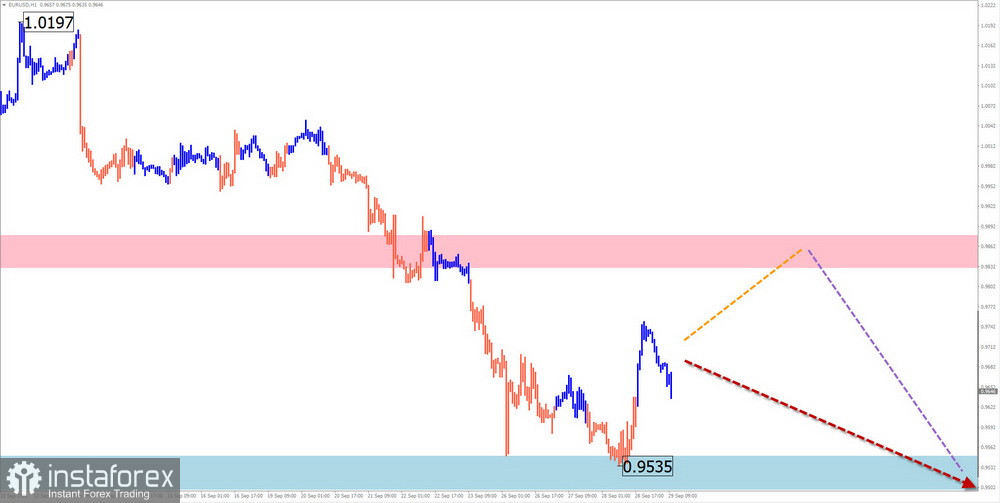
The downward trend continues to shift lower on the chart of the main pair of the European currency. Over the past week, two main events have occurred with the pair: the price pushed down a powerful support level, and the formation of an intermediate correction of the last section of the trend began. Its wave level is insufficient to start a reversal. This is an unambiguous indication of the continuation of the bearish trend.
The forecast for the week:
In the next couple of days, we can expect a weak upward vector, with the rate rising to the levels of calculated resistance. Next week, a reversal is expected to form in this zone and the resumption of the downward course. The calculated support zone will limit the dynamics of the decline.
Potential reversal zones
Resistance:
- 0.9830/0.9880
Support:
- 0.9550/0.9500
Recommendations
Purchases can be used within the framework of individual sessions with a reduced lot.
Sales are not recommended until confirmed reversal signals appear in the area of the resistance zone.
USD/JPY
Brief analysis:
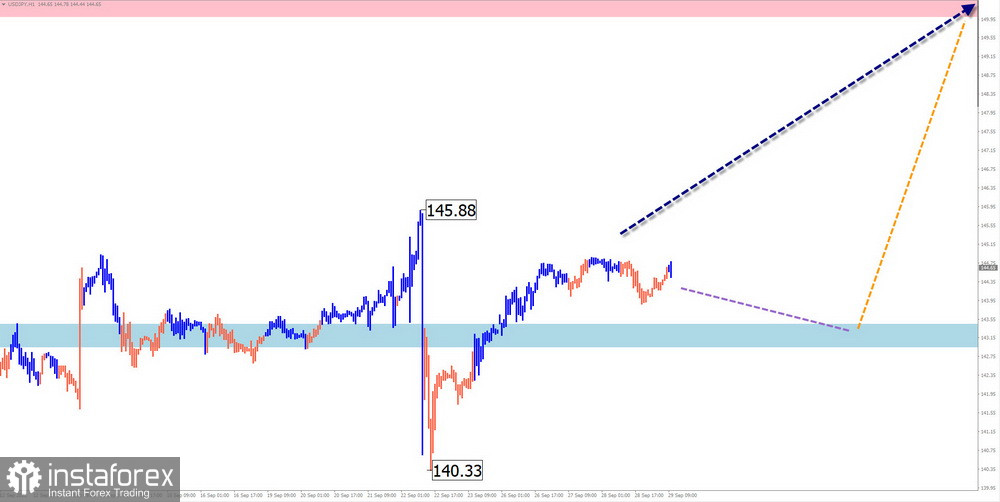
On the Japanese yen chart, upward momentum has formed within the bullish trend since August 2. The first two parts (A and B) have now fully formed in their structure. Since September 22, the beginning of the final part (C) has been developing. In the last days before the start of an active rise, quotes form an intermediate pullback.
The forecast for the week:
In the coming days, the most likely scenario will be a lateral drift along the boundaries of the calculated support. After the weekend, you can expect an increase in volatility, a reversal, and the beginning of active growth of the pair's rate. The output of important news blocks can serve as a temporary reference point.
Potential reversal zones
Resistance:
- 150.00/150.50
Support:
- 143.50/143.00
Recommendations
Sales: due to the small potential, they are high-risk and can lead to losses.
Purchases: recommended after the appearance of reversal signals in the area of the support zone, confirmed by the vehicles you use.
GBP/JPY
Brief analysis:
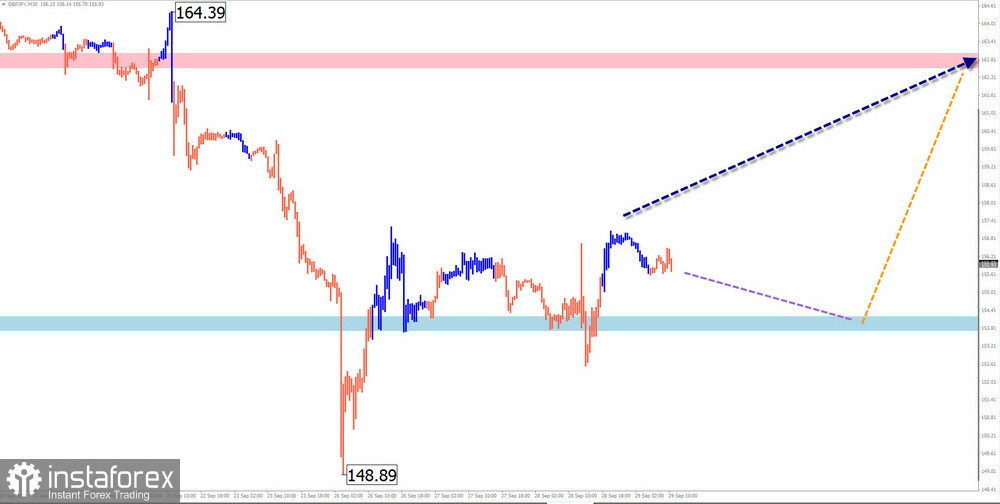
There have been significant changes on the chart of the pound/yen pair over the past week. The downward wave that has been going on since April has ended. On a larger scale, this section formed a full-fledged correction to the previous up trend. The ascending section from September 26 has reversal potential. After its confirmation, it will give rise to a new short-term upward trend.
Forecast for the week:
In the coming days, the pair's chart is expected to show mainly a sideways vector of price movement along the levels of the support zone. Next week, the end of the flat period is expected, a reversal and the beginning of active growth of the exchange rate. The increase in volatility may be timed to coincide with the release of important news blocks.
Potential reversal zones
Resistance:
- 162.50/163.00
Support:
- 154.20/153.70
Recommendations
Sales are possible within individual trading sessions with a fractional lot. They have a small potential.
Purchases can be recommended after the appearance of confirmed signals for opening deals in the area of the support zone.
USD/CAD
Brief analysis:
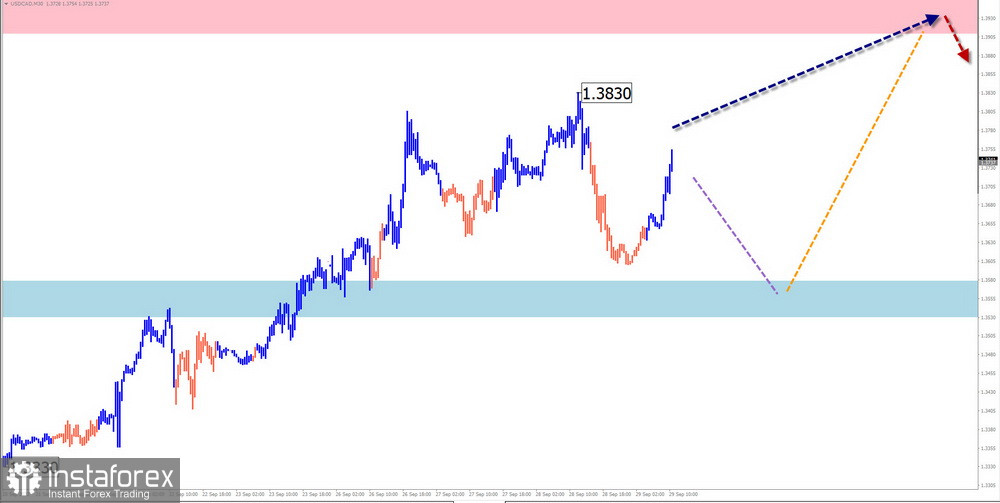
The current wave structure on the Canadian dollar chart is descending, counting down from March 2020. Moreover, the incomplete short-term trend since May last year forms the correction part (B). The structure of this wave looks complete. The price has reached the lower limit of a powerful resistance zone of a large TF. There are no signals of an imminent reversal on the chart yet.
Forecast for the week:
In the coming days, there is a high probability of a flattening trend with a downward vector. The price movement is probably no further than the support boundaries. Next week, we can count on the formation of a reversal and the resumption of the upward course of movement. The calculated resistance demonstrates the most probable section of the end of the entire wave.
Potential reversal zones
Resistance:
- 1.3910/1.3960
Support:
- 1.3580/1.3530
Recommendations
Sales: risky and not recommended.
Purchases will become profitable after the appearance of signals confirmed by your vehicle in the area of the support zone. In transactions, it is worth considering the limited potential for recovery.
Explanations: In simplified wave analysis (UVA), all waves consist of 3 parts (A-B-C). At each TF, the last incomplete wave is analyzed. The dotted line shows the expected movements.
Attention: the wave algorithm does not consider the duration of the movements of the instruments in time!