Using complex analysis, we can see that the quotes underwent a local acceleration, which was expected in the market.
The current trading week is coming to an end. Looking back at it, we can see the horizontal course of the prices, in which the range level 1.1180 [1.1165 // 1.1180 // 1.1190] plays an integral role of support in the current price fluctuation.
For as many as four times a week, the quote underwent pressure as soon as it approached the borders of the range. But, market participants reversed their positions, which put the quote into a pullback and made the 1.1300 / 1.1350 area become a variable resistance level. This hindered the rollback from developing into something more.
With regards to the downward tact observed on June 11, a recovery occurred, during which the quotes reached the level of 1.1180 [June 19]. Afterwards, they began to bounce from the area of 1.1180, which resulted to the loss of trading volumes and led to the formation of variable fluctuations and emergence of a new movement - horizontal.
Nevertheless, it is still unclear whether this fluctuation will become the future range of 1.1180 // 1.1300 // 1.1440 (1.1500). There are signs pointing to it, but the conditions for development are not enough. If we compare it with the movement on the GBP / USD pair, we will see a downward tact whose structure has not been violated. This suggests that if the downward trend in the pound remains, then the downward trend in the EUR / USD pair will prevail as well. Thus, to form the range 1.1180 // 1.1300 // 1.1440 (1.1500), a number of technical factors is needed in order to set the mood for the market.
Analyzing the trading conducted yesterday in detail, we can see that a round of short positions arose at 10:00 (UTC + 1), during which the quotes were able to touch the level of 1.1300. The main bursts of activity started at the beginning of the American session, coinciding with the time that important news were published.
The most remarkable moment was the accumulation of quotes, which started at 17:00 (UTC + 1).
With regards to volatility, a value close to the daily average was recorded, which indicates the intense movement of quotes yesterday.
As discussed in the previous review, traders considered the level of 1.1300 as a resistance and the news as a lever to strengthen the US dollar, which ultimately led to profitable deals.
Analyzing the trading chart in general terms (the daily period), we can see the last five candles are "Doji", which indicates instability and the possible occurrence of impulse movement. In the event of damage, a radical change awaits us relative to the existing fluctuation.
The news published yesterday contained reports on the US labor market, which greatly pleased traders and inspired brighter prospects for the future. According to the data, the unemployment rate fell from 13.3% to 11.1% in June, better than the forecast of 12.3%. Jobs outside of agriculture increased by 4,800,000, much higher than the forecast of 2,509,000.
Market reaction to such good data strengthened the US dollar.
As for weekly applications for unemployment benefits in the US, initial applications decreased from 1,482,000 to 1,427,000, while repeated applications increased from 19,231,000 to 19,290,000.
With such improving figues, US President Donald said that the US economy is rapidly recovering from its losses during the coronavirus pandemic.
"The US economy recorded almost 5 million new jobs in June, which exceeded all expectations. This is the most significant increase in the history of our country, "Trump said.
At the same time, the head of the Washington administration noted that there were no similar results for the third quarter in history, which is an excellent indicator, especially before the elections. "Voters will be able to see our effective work. The fourth quarter will also be incredibly good, and the next year will be completely historic. "
Today, the final data on business activity in Europe was published, in which according to the report, the index for the services sector recorded growth from 30.5 to 48.3, and the composite PMI grew from 31.9 to 48.5.
Market reaction to these was negligible.
The United States is on a holiday today, in celebration to the country Independence Day. It will definitely affect today's trading volumes.
The upcoming trading week is not as busy as this current week. The main stimulus for price jumps will be the external news, coupled with a number of speculative jumps due to unstable market sentiment.
Below are the most important events for next week:
Monday, July 6 (UTC + 1)
EU 10:00 - Retail sales (May)
US 15:00 - ISM business activity index for the services sector (July)
Tuesday July 7
US 15:00 - JOLTS (May)
Thursday, July 9
US 13:30 - Applications for unemployment benefits
Friday, July 10
US 13:30 - Producer Price Index (June)
Further development
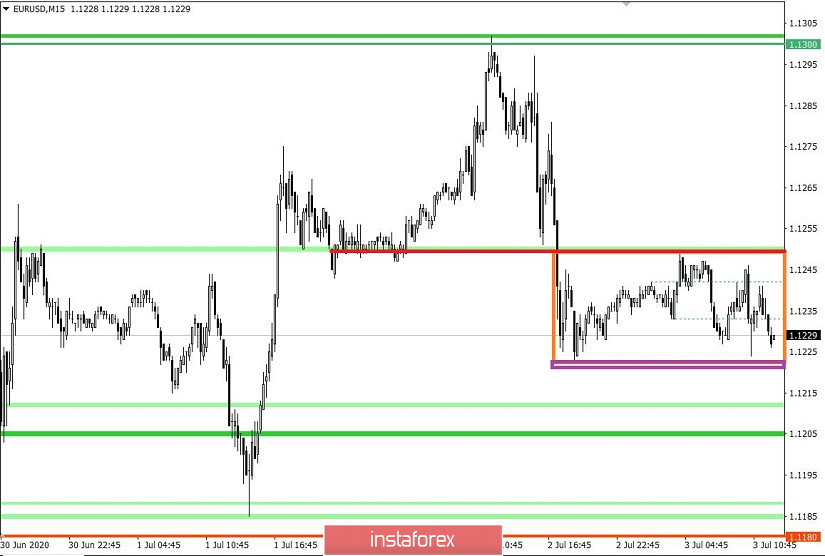
Analyzing the current trading chart, we can see that the quotes underwent an accumulation at 1.1225 / 1.1250 yesterday, in which the level of 1.1250 became the upper limit of the range. Such a fluctuation is just temporary, thus, if the downward move observed yesterday continues in the market, the quotes will decline to the level 1.1180 [1.1165 // 1.1180 // 1.1190].
If the quotes consolidate lower than 1.1220, the pair will move towards the level 1.1190 / 1.1180, where we should be extremely careful because a rebound could happen especially if the quotes consolidate lower than 1.1165.
An alternative scenario will happen if the quotes consolidate instead above the mirror level 1.1250, which will lead to a price move in the direction of 1.1280–1.1300.
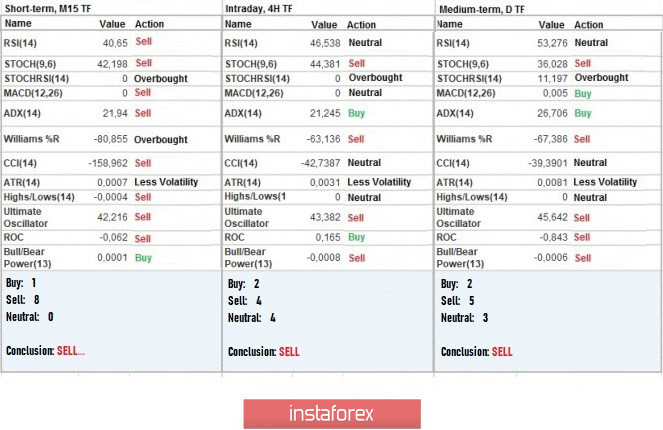
Indicator analysis
Analyzing the different sectors of time frames (TF), we can see that the indicators of technical instruments in the minute, hour and day periods signal sell due to the drop of prices below 1.1250.
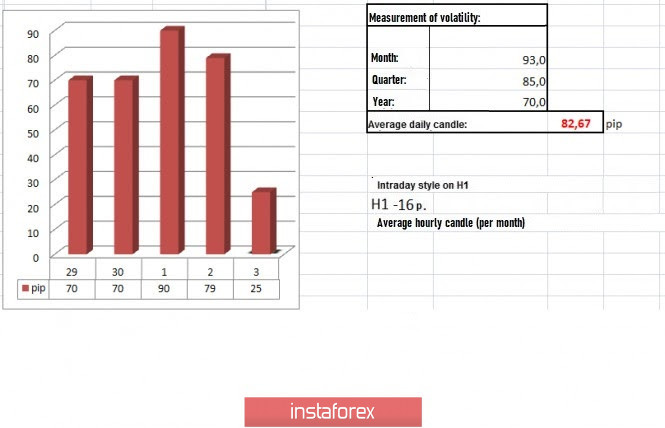
Volatility per week / Measurement of volatility: Month; Quarter Year
The measurement of volatility reflects the average daily fluctuation calculated by Month / Quarter / Year.
(July 3 was built, taking into account the time of publication of the article)
The volatility of the current time is 25 points, which is 69% lower than the daily average. Since the United States is on a holiday, activity in the markets will be low today.
Key levels
Resistance Zones: 1.1300; 1.1440 / 1.1500; 1.1650 *; 1.1720 **; 1.1850 **; 1,2100
Support areas: 1.1180 **; 1.1080; 1,1000 ***; 1.0850 **; 1.0775 *; 1.0650 (1.0636); 1,0500 ***; 1.0350 **; 1,0000 ***.
* Periodic level
** Range Level
*** Psychological level