EUR/USD 1H
The euro/dollar pair was almost growing all day on the hourly timeframe on September 10, and was in the resistance area of 1.1884-1.1910 by the end of the day. The price previously rebounded off this area at least four times. Actually, we have repeatedly said that the pair has been trading mainly in the sideways channel of 1.17-1.19 in the last month and a half and only occasionally makes attempts to leave it. In addition, the price likes to rebound off previous local lows and highs, of which a fairly large number has accumulated over the past month and a half. Thus, we can state the following based on Thursday's results: the pair remained inside the side channel and may pursue the lower line of this channel at 1.1700 in the coming days; quotes have left the downward channel, so we do not have a clear trend at this time, according to which you could trade.
EUR/USD 1H

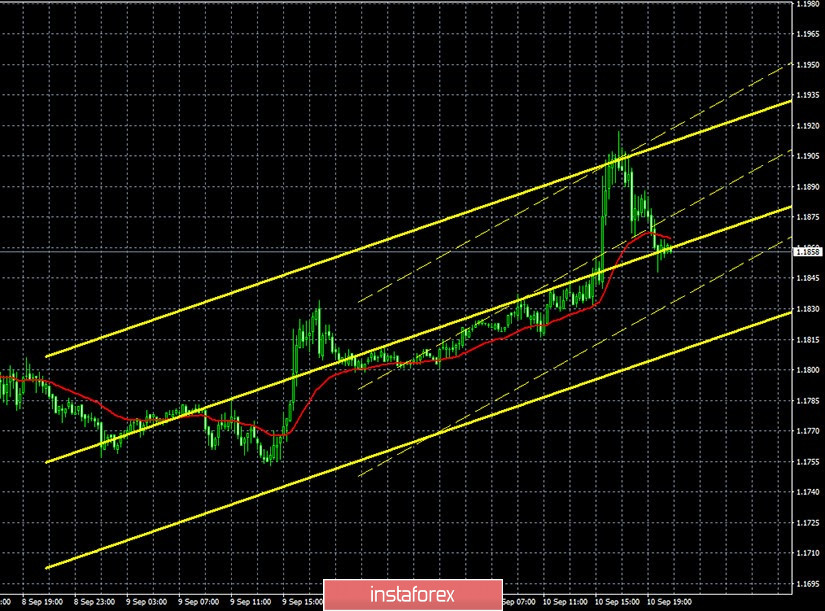
Both linear regression channels turned upward on the 15-minute timeframe, but channels may start to go down on Friday. The latest Commitment of Traders (COT) report, which, let me remind you, comes out with a three-day delay so it only covers the dates from August 26 to September 1, unexpectedly showed that the "non-commercial" category of traders decreased their net position. Non-commercial traders are the most important category of traders who enter the foreign exchange market in order to make a profit. So, non-commercial traders reduced Buy-positions (longs) and opened Sell-contracts (shorts) during the reporting week. The number of Buy-contracts decreased by almost 11,000, while the number of Sell-contracts increased by 3,000. Thus, the net position immediately decreased by 14,000. We would like to take note that the euro did not fall in price during the reporting week, which is covered by the latest COT report. The euro strengthened during all five trading days, and only started to fall on September 1, which, in fact, did not last long. The downward movement continued from September 2 to September 8, however, quotes failed to get out of the range of 1.17-1.19, after which it began to grow. However, this growth will not be included in the next COT report, which will be released today. Therefore, we can see only small changes in the new report, since the technical picture for the euro has not significantly changed.
The European Union summed up the results of the ECB meeting on September 10, which we talked about in detail in the fundamental review for the euro. Let's just say that, from our point of view, the euro's growth was completely unfounded and, given that it rebounded from the resistance area of 1.1884-1.1910, we believe that a new round of downward movement within the side channel will begin today. We highlight the US inflation report from today's macroeconomic reports. It is regaining a high degree of importance as the EU and US economies begin to recover and central banks are re-orienting themselves to inflation. If in the EU inflation collapsed to -0.2% in August, then it may remain at a very decent level of 1.0-1.2% y/y in the United States. And if we talk about core inflation, then it is 1.6% y/y. Thus, the US dollar can receive support today.
We have two trading ideas for September 11:
1) Bulls made a fairly strong jump yesterday, but failed to gain a foothold above the 1.1884-1.1910 area. Therefore, we recommend that you only consider new long positions if this area is overcome with the target on the resistance level of 1.1972. Take Profit in this case will be about 50 points.
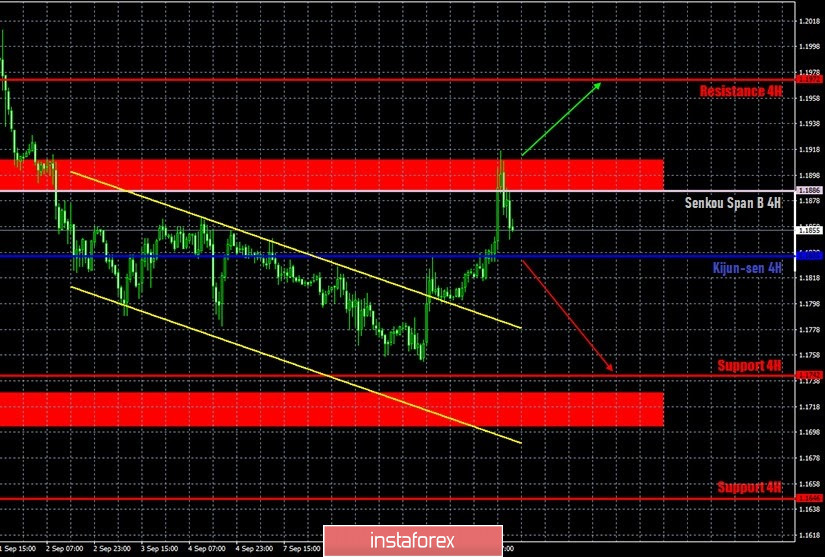
2) Bears got a new opportunity to pull down the EUR/USD pair to the lower area of the side channel of 1.17-1.19, since the 1.1884-1.1910 area was not overcome, a rebound was also made from the Senkou Span B line. And so we recommend that you wait until you get to settle below the Kijun-sen line (1.1835) and start trading down while aiming for 1.1742. The potential Take Profit in this case is about 80 points.
Explanations for illustrations:
Support and Resistance Levels are the levels that serve as targets when buying or selling the pair. You can place Take Profit near these levels.
Kijun-sen and Senkou Span B lines are lines of the Ichimoku indicator transferred to the hourly timeframe from the 4-hour one.
Support and resistance areas are areas from which the price has repeatedly rebounded off.
Yellow lines are trend lines, trend channels and any other technical patterns.