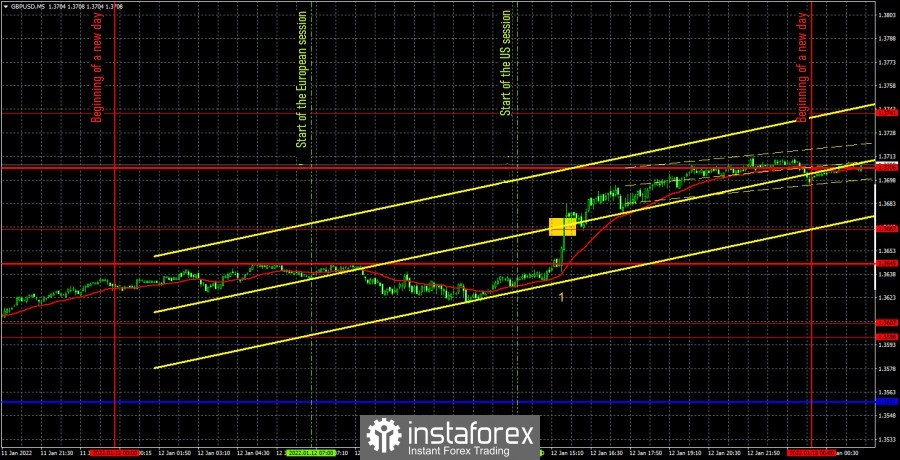
GBP/USD 5M

The GBP/USD currency pair was in thought for some time on Wednesday, but in the afternoon, without even waiting for the US inflation report, it resumed growth. Thus, the pound is still showing growth, which on some days looks just amazing. We were waiting for a new upward trend in the pound in the second half of 2021, as well as in the euro, but at this time there are few fundamental reasons for strengthening the pound. The pair cannot grow for four consecutive weeks only on the basis of one rate increase by the Bank of England! Yesterday, the British currency still had a reason to show growth. One can argue for a long time about whether the reaction of traders to the report on US inflation was logical, but the fact remains that the dollar continued to fall in price. But there were few technical signals for the pound during the day and they were not as profitable as for the euro currency. In fact, only one buy signal was formed. Moreover, at a time when most of the upward movement has already been left behind. Nevertheless, the price crossed the extreme level of 1.3667, so traders could open long positions at this moment. However, after a couple of hours they could be closed manually, because we always recommend closing all positions in the evening. Thus, it was possible to earn only 15 points with a volatility equal to 75 points. Nevertheless, 15 points of profit is better than a loss, and better than five open trades. Despite the lack of technical support (the upward trend line on the hourly timeframe is no longer relevant), the pound continues to grow and you need to use it. The movement is very good, trending, it's stupid to miss it.
We recommend you to familiarize yourself:
Overview of the EUR/USD pair. January 13. The market did not appreciate Jerome Powell's speeches.
Overview of the GBP/USD pair. January 13. US Inflation has risen again. Boris Johnson's apologies for the lockdown party.
Forecast and trading signals for EUR/USD for January 13. Detailed analysis of the movement of the pair and trade deals.
GBP/USD 1H
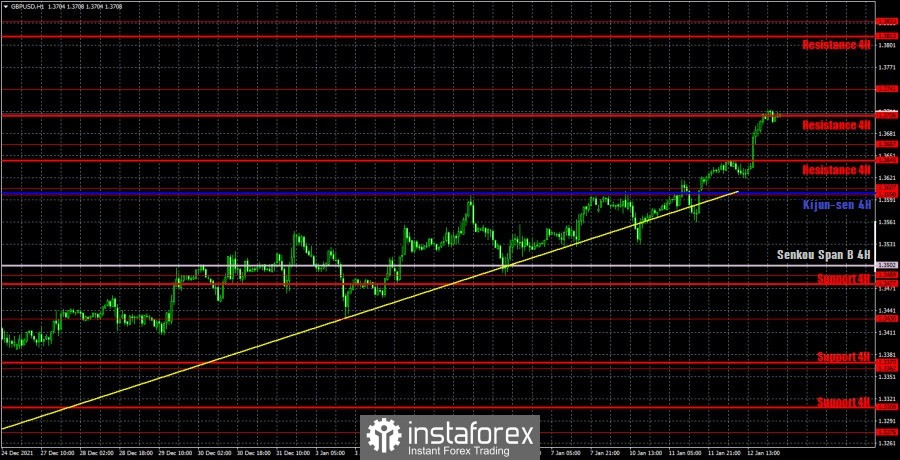
On the hourly timeframe, the pound/dollar pair continues its upward movement, although it previously settled below the ascending trend line twice. Therefore, the trend line is not relevant at this time, but it can be left on the chart solely to illustrate the upward trend. Yesterday, the pair was supported by important macroeconomic statistics, but in general we expect at least a downward correction, after which the pound may resume its appreciation. We highlight the following important levels on January 13: 1.3598-1.3607, 1.3667, 1.3741, 1.3833. The Senkou Span B (1.3502) and Kijun-sen (1.3601) lines can also be signal sources. Signals can be "bounces" and "breakthroughs" of these levels and lines. It is recommended to set the Stop Loss level to breakeven when the price passes in the right direction by 20 points. The lines of the Ichimoku indicator can move during the day, which should be taken into account when determining trading signals. There are no interesting events and publications scheduled for Thursday in the UK, all the most interesting things in Britain are scheduled for Friday. The calendar of events in the US is also almost completely empty. Thus, the long-awaited correction for the pound may begin today. The Ichimoku indicator lines now act as a support for the upward trend. And overcoming the critical line can open the way for the pair to the Senkou Span B line.
Explanations for the chart:
Support and Resistance Levels are the levels that serve as targets when buying or selling the pair. You can place Take Profit near these levels.
Kijun-sen and Senkou Span B lines are lines of the Ichimoku indicator transferred to the hourly timeframe from the 4-hour one.
Support and resistance areas are areas from which the price has repeatedly rebounded off.
Yellow lines are trend lines, trend channels and any other technical patterns.
Indicator 1 on the COT charts is the size of the net position of each category of traders.
Indicator 2 on the COT charts is the size of the net position for the non-commercial group.