empty
 
 
25.05.2022 08:27 AM
Hot forecast of GBP/USD on May 25, 2022

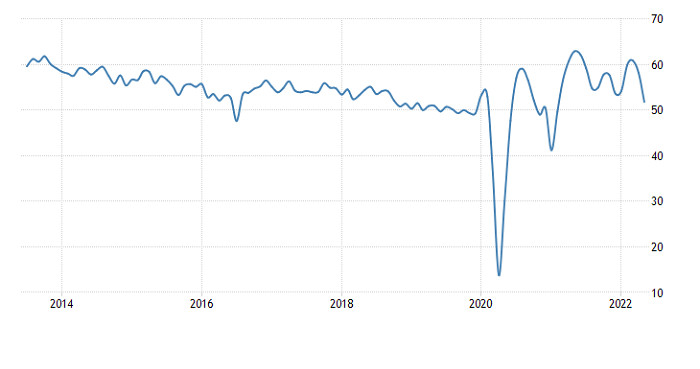
Preliminary UK PMIs came in much worse than expected. The flash UK manufacturing PMI slipped to 54.6 in April from 55.8 in March, whereas economists had projected a 55.2 score. Besides, the services PMI slumped to 51.8 from 58.9 in the previous month. The consensus suggested a downtick to 58.0. No wonder, following the publication of the flash PMIs, the pound sterling sharply went down.

UK Composite PMI

This image is no longer relevant

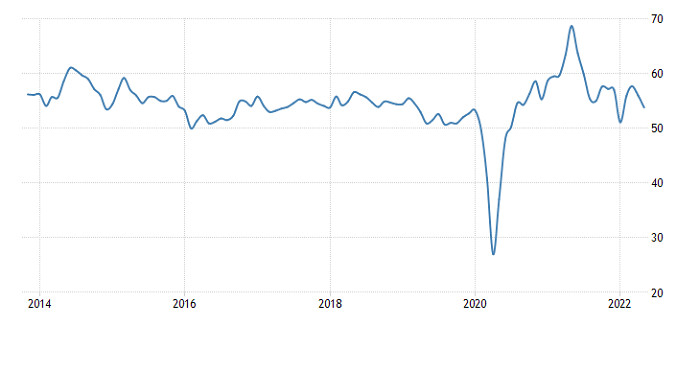
However, in the early New York session, the sterling managed to win back some of its losses. Interestingly, equivalent data from the UK was also way worse than projected. In particular, the services PMI sank to 53.5 in April from 55.6 a month ago, whereas analysts had expected the reading at 55.0 points. The US manufacturing PMI dropped to 57.5 from 59.2. The forecast was about a moderate decline to 57.5. Last but not least, the composite PMI fell to 53.8 from 56.0, much sharper than the expected decline to 55.5.

US Composite PMI

This image is no longer relevant

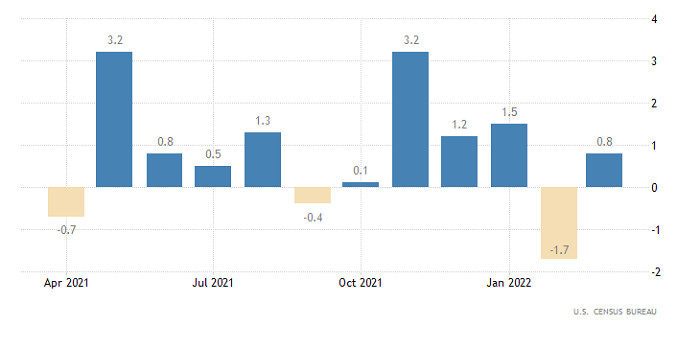
Today the US dollar could receive extra support from a report on US durable goods orders. Thevolume is expected to rise 0.4% in April. It is going to be a decent growth, indicating a further improvement in consumer activity. Hence, the US dollar is set to gain ground.

US Durable Goods Orders

This image is no longer relevant

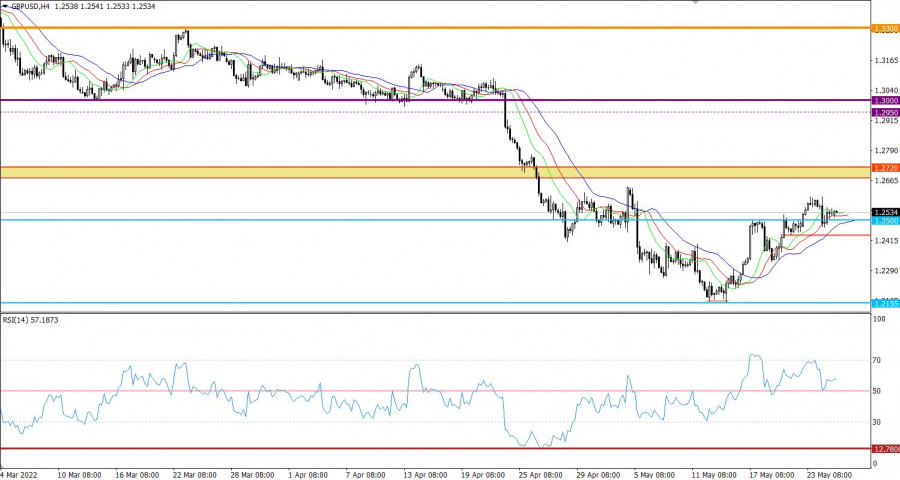
GBP/USD rebounded to 1.2500 in the course of the recent upward retracement. Traders cut on short positions from that level. As a result, the currency pair got stuck in a trading range.

The H4 RSI technical instrument is moving in the upper area of 50/70, thus indicating high interest in buying the pair. The D1 RSI is hovering at around the average line of 50. This could signal an extended correction.

Moving averages of the H4 Alligator are directed upward, indicating that the correction is still going on. The D1 Alligator signals a slowdown in the downtrend.

Outlook and trading tips

The level of 1.2500 passed earlier acts as interim support. In this case, a signal of an extendedcorrectional will be generated after the price settles above 1.2600. This move will open the door for the buyers towards 1.2700.

The alternative scenario will come into play when the correction is over. To confirm this signal, the price has to settle below 1.2420 on the 4-hour chart.

Complex indicator analysis suggests buying in the short term and intraday on the back of the correction. As previously, technical indicators signal selling in the medium term because of the overall downtrend.

This image is no longer relevant

Dean Leo,
Analytical expert of InstaForex
© 2007-2024
Earn on cryptocurrency rate changes with InstaForex
Download MetaTrader 4 and open your first trade
  • Grand Choice
    Contest by
    InstaForex
    InstaForex always strives to help you
    fulfill your biggest dreams.
    JOIN CONTEST
  • Chancy Deposit
    Deposit your account with $3,000 and get $1000 more!
    In April we raffle $1000 within the Chancy Deposit campaign!
    Get a chance to win by depositing $3,000 to a trading account. Having fulfilled this condition, you become a campaign participant.
    JOIN CONTEST
  • Trade Wise, Win Device
    Top up your account with at least $500, sign up for the contest, and get a chance to win mobile devices.
    JOIN CONTEST
  • 100% Bonus
    Your unique opportunity to get a 100% bonus on your deposit
    GET BONUS
  • 55% Bonus
    Apply for a 55% bonus on your every deposit
    GET BONUS
  • 30% Bonus
    Receive a 30% bonus every time you top up your account
    GET BONUS

Recommended Stories

Can't speak right now?
Ask your question in the chat.
Widget callback