Details of the economic calendar for September 26
The macroeconomic calendar was empty; no important statistics were published. Investors and speculators worked out the information flow of the past week.
The UK Treasury yesterday commented on everything that is happening in the country's economy, the main theses:
- The medium-term financial plan will be presented on November 23.
- The budget plan will set out additional details, including ensuring that the share of UK debt to GDP falls in the medium term.
At the same time, the Bank of England made its comments:
- We closely monitor the market for significant revaluation of financial assets;
- We will not hesitate to raise the interest rate to bring inflation back to the target level of 2.0%.
According to media reports, traders are waiting for an unscheduled rate hike by the Bank of England amid the collapse of the national currency. Perhaps this was the reason for such a significant pullback. There is no confirmation of rumors regarding an unscheduled rate hike. If the regulator does not take any drastic action, the pound will continue to decline.
Analysis of trading charts from September 26
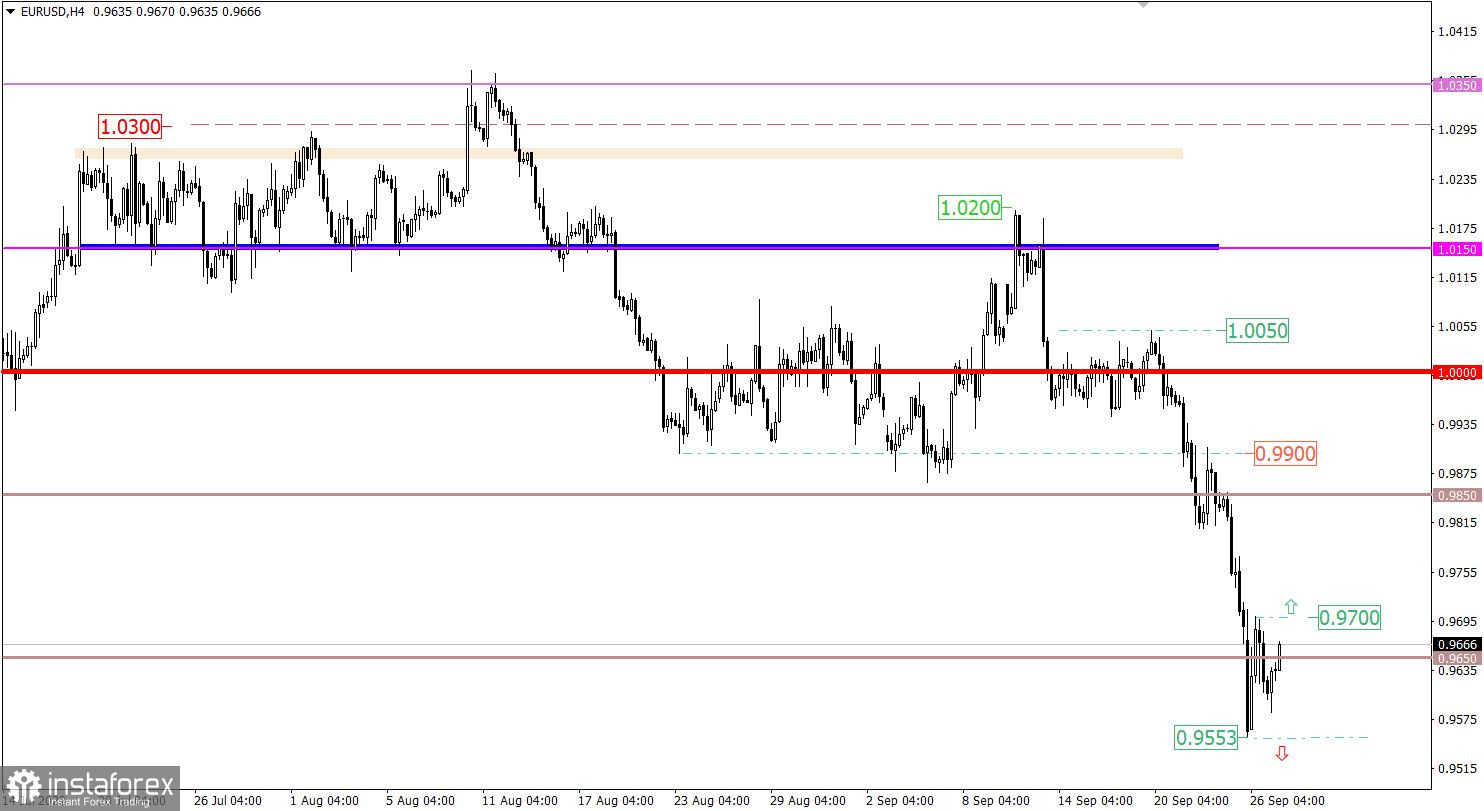
The EUR/USD currency pair opened a new trading week with an update of the low of the downward trend. As a result, the quote reached the levels of June 2002, at 0.9553, relative to which the stage of technical pullback occurred.
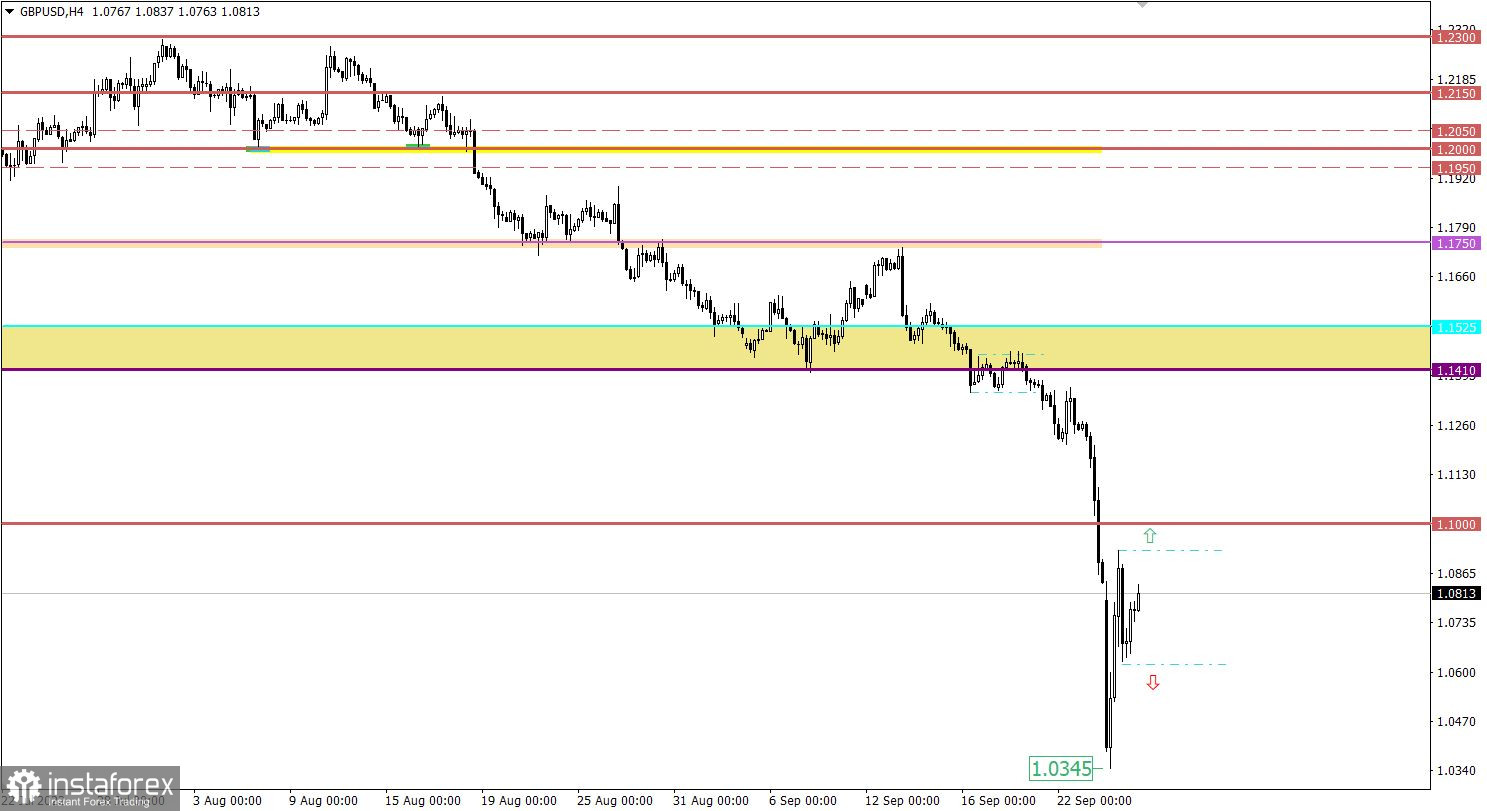
The GBP/USD currency pair has set several records at once. The absolute low was updated, the quote overcame the level of 1985, eventually reaching the value of 1.0345. The scale of the pound's collapse from last Friday to the beginning of Monday's trading amounted to almost 1,000 points, while the pullback caused by the fatal overheating of short positions on the pound was about 550 points.
Economic calendar for September 27
Today, data on orders for durable goods in the United States will be published, which may decrease by 0.9%. This is a fairly strong reduction, which foreshadows a noticeable decline in consumer activity, which is the locomotive of the American economy. As a result, these negative data, if confirmed, can put pressure on dollar positions.
Also, U.S. Federal Reserve Chairman Jerome Powell and ECB President Christine Lagarde are scheduled to give a speech. It is worth listening to what they will say, although everything has already been said before.
Time targeting:
Fed Chairman Jerome Powell Speech – 11:30 UTC
ECB President Christine Lagarde Speech – 11:30 UTC
U.S. Durable Goods Orders (August) – 12:30 UTC
Trading plan for EUR/USD on September 27
At the moment, there is a characteristic stagnation, where the pullback stage has slowed down its formation despite the continuing technical signal about the oversold euro. In order for the pullback to be prolonged and become the starting point for a full-size correction, the quote first needs to stay above the value of 0.9700 for at least a four-hour period.
At the same time, the downward scenario will become relevant again as soon as the current low is updated.
Trading plan for GBP/USD on September 27
In this situation, there is still a speculative rush on the market, which allows new price jumps. In order to prolong the current pullback, the quote needs to stay above the high of the previous day at 1.0928. At the same time, the scenario of further decline will be considered by traders if the price holds below 1.0630.
What is shown in the trading charts?
A candlestick chart view is graphical rectangles of white and black light, with sticks on top and bottom. When analyzing each candle in detail, you will see its characteristics of a relative period: the opening price, closing price, and maximum and minimum prices.
Horizontal levels are price coordinates, relative to which a stop or a price reversal may occur. These levels are called support and resistance in the market.
Circles and rectangles are highlighted examples where the price of the story unfolded. This color selection indicates horizontal lines that may put pressure on the quote in the future.
The up/down arrows are the reference points of the possible price direction in the future.