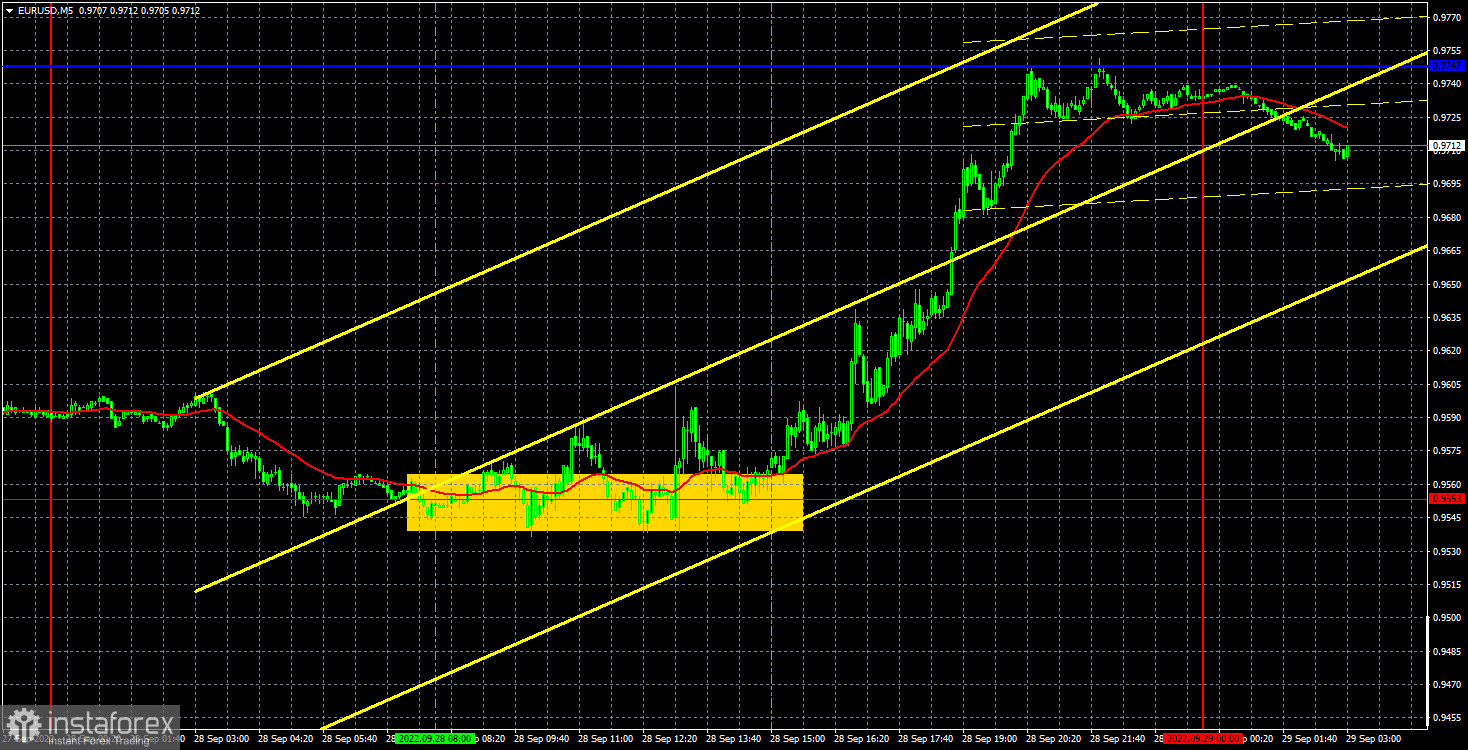
EUR/USD 5M.
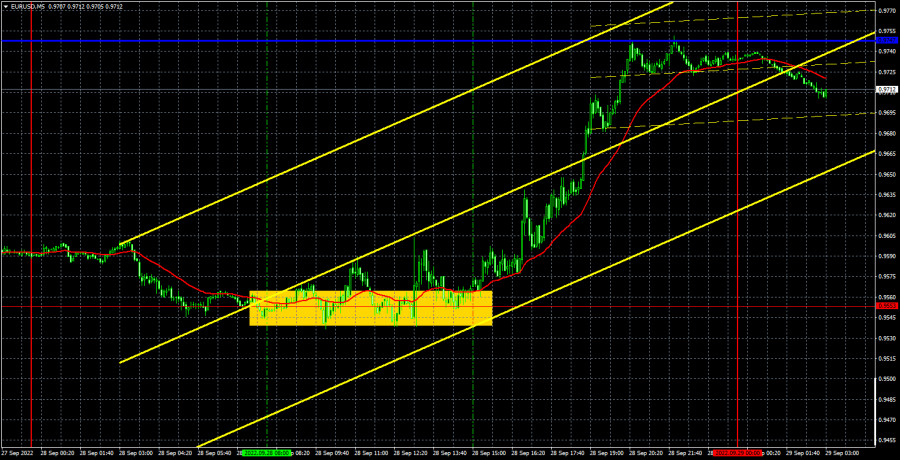
The euro/dollar again showed very high volatility on Wednesday. The second test of the 0.9553 level took place, which is currently a 20-year low, but was a failure. After that, a fairly strong growth of the euro began, which theoretically could become the beginning of a new trend. If you remember, we said that a new trend should start abruptly and strongly, not imposingly. However, at the moment the price is still below both lines of the Ichimoku indicator, so the downward trend still remains. What caused the euro's growth. From our point of view, such a statement of the question is absolutely incorrect. After the euro has lost over 2500 points, a 100-150 points upward move could be a simple pullback. The pair cannot fall forever, there must be at least some pullbacks, and we don't even remember the corrections anymore. Possibly, this pullback was provoked by Federal Reserve Chairman Jerome Powell's speech, although we do not believe that he has changed the vector of his rhetoric dramatically. In any case, a rebound from the critical line will provoke a new round of decline.
In regards to yesterday's trading signals, the situation was difficult. Traders tried to break through the level of 0.9553 throughout the European trading session, but failed to do so. Because of this, a fairly large number of signals were formed, most of which turned out to be false. What matters here is how traders interpreted these signals. They could be "seen" as buy signals or sell signals interspersed with buy signals. Long positions could eventually bring a good profit. In the second option, it was necessary to work out the first two signals, and they turned out to be false.
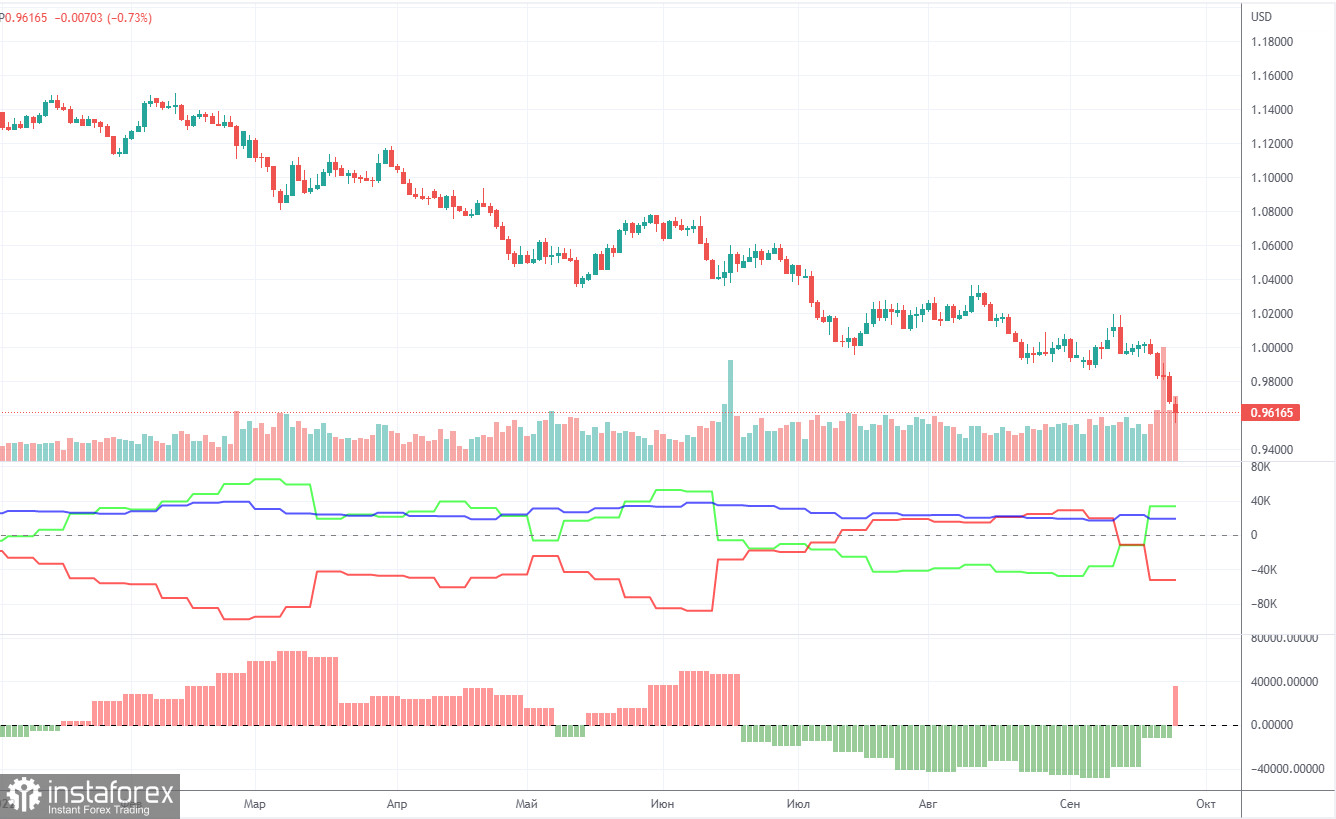
COT report:
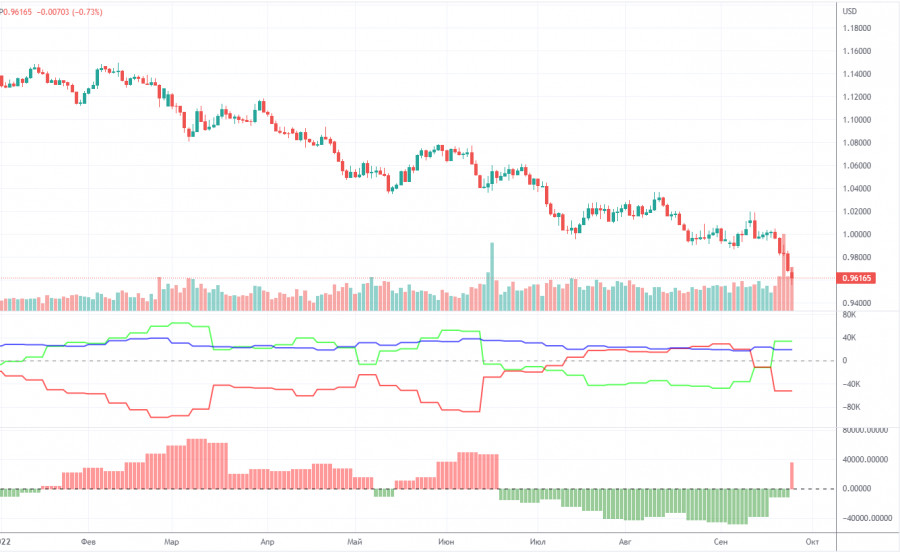
The Commitment of Traders (COT) reports on the euro in the last few months clearly reflect what is happening in the euro/dollar pair. For half of 2022, they showed a blatant bullish mood of commercial traders, but at the same time, the euro fell steadily. At this time, the situation is different, but it is NOT in favor of the euro. If earlier the mood was bullish, and the euro was falling, now the mood is bearish and... the euro is also falling. Therefore, for the time being, we do not see any grounds for the euro's growth, because the vast majority of factors remain against it. During the reporting week, the number of long positions for the non-commercial group increased by 2,500, while the number of shorts decreased by 22,000. Accordingly, the net position grew by about 24,500 contracts. This is quite a lot and we can talk about a significant weakening of the bearish mood. However, so far this fact does not provide any dividends to the euro, which still remains "at the bottom". The only thing is that in recent weeks it has done without another collapse, unlike the pound. At this time, commercial traders still do not believe in the euro. The number of longs is lower than the number of shorts for non-commercial traders by 12,000. This difference is no longer too large, so one could expect the start of a new upward trend, but what if the demand for the US dollar remains so high that even the growth in demand for the euro does not save the situation for the euro/dollar currency pair?
We recommend to familiarize yourself with:
Overview of the EUR/USD pair. September 29. The euro is falling down ahead of September 30 and amid the general geopolitical background.
Overview of the GBP/USD pair. September 29. Theater of the absurd with Nord Stream.
Forecast and trading signals for GBP/USD on September 29. Detailed analysis of the movement of the pair and trading transactions.
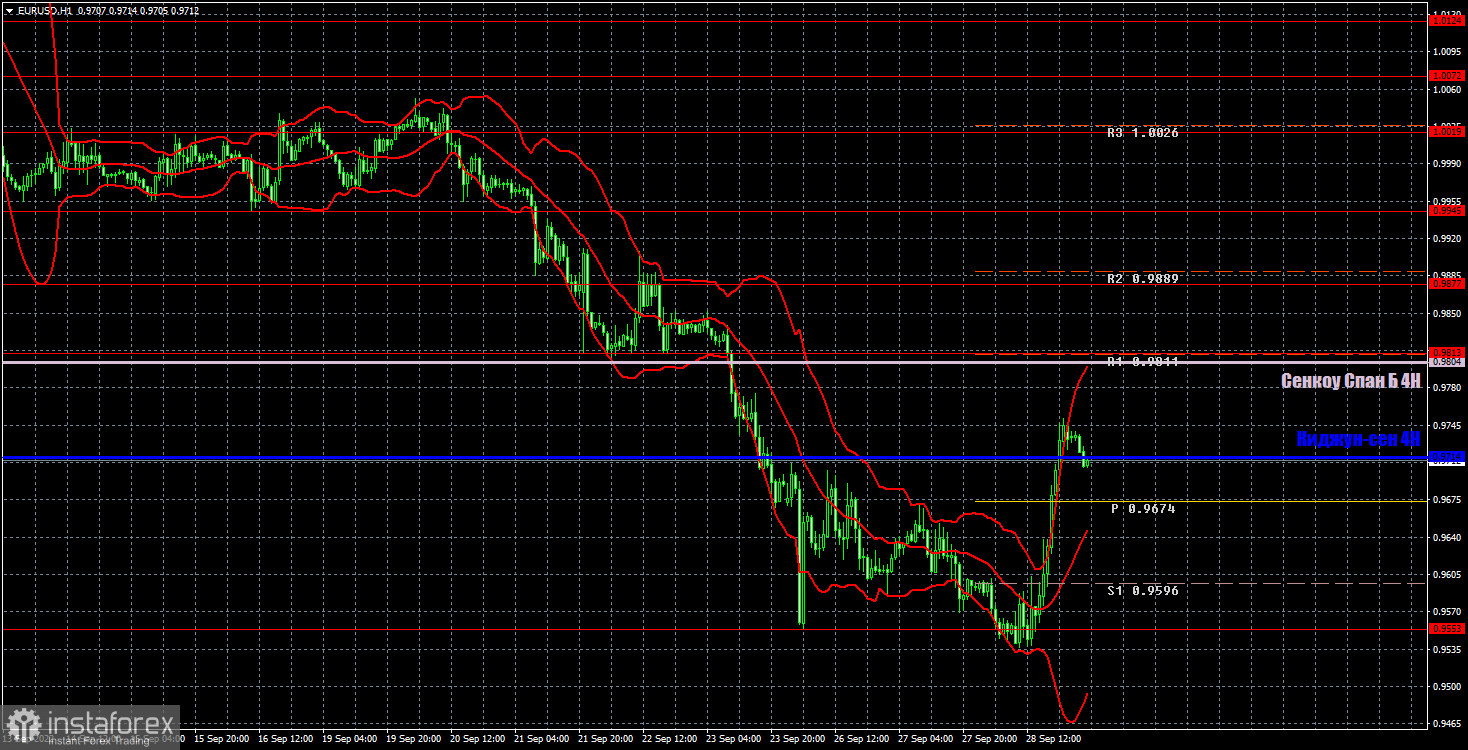
EUR/USD 1H
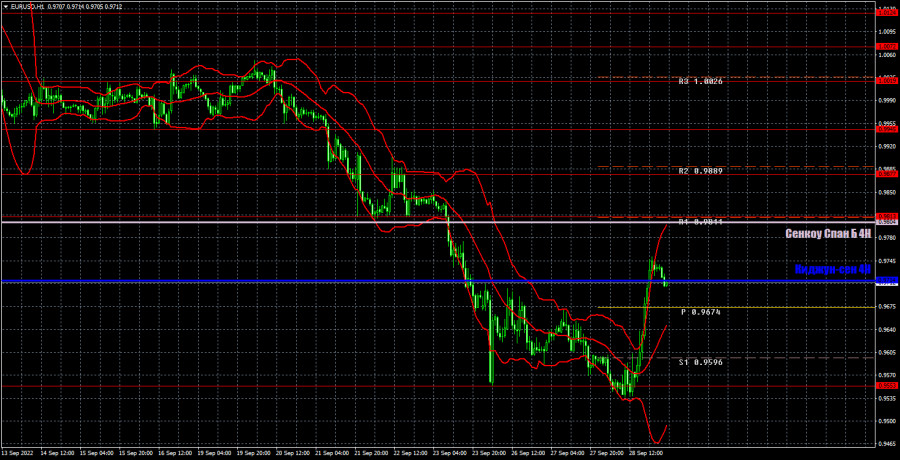
The bears' prospects remain just fine on the hourly timeframe, given that the pair continues to remain below the key Ichimoku lines. Yesterday's rise should not be misleading. Now, if Senkou Span B and Kijun-sen are overcome, then it will be possible to speak of an upward trend, at least a small one. But so far it hasn't. We highlight the following levels for trading on Thursday - 0.9553, 0.9813, 0.9877, 0.9945, 1.0019, as well as the Senkou Span B (0.9804) and Kijun-sen (0.9714) lines. Ichimoku indicator lines can move during the day, which should be taken into account when determining trading signals. There are also secondary support and resistance levels, but no signals are formed near them. Signals can be "rebounds" and "breakthrough" extreme levels and lines. Do not forget about placing a Stop Loss order at breakeven if the price has gone in the right direction for 15 points. This will protect you against possible losses if the signal turns out to be false. Several speeches by representatives of central banks will take place in the European Union and the United States, and only secondary macroeconomic statistics are scheduled for today. In any case, the euro continues to be traded in a very volatile manner, so traders clearly do not need help now.
Explanations for the chart:
Support and Resistance Levels are the levels that serve as targets when buying or selling the pair. You can place Take Profit near these levels.
Kijun-sen and Senkou Span B lines are lines of the Ichimoku indicator transferred to the hourly timeframe from the 4-hour one.
Support and resistance areas are areas from which the price has repeatedly rebounded off.
Yellow lines are trend lines, trend channels and any other technical patterns.
Indicator 1 on the COT charts is the size of the net position of each category of traders.
Indicator 2 on the COT charts is the size of the net position for the non-commercial group.