empty
 
 
14.11.2022 04:22 PM
EUR/USD analysis on November 14, 2022

This image is no longer relevant

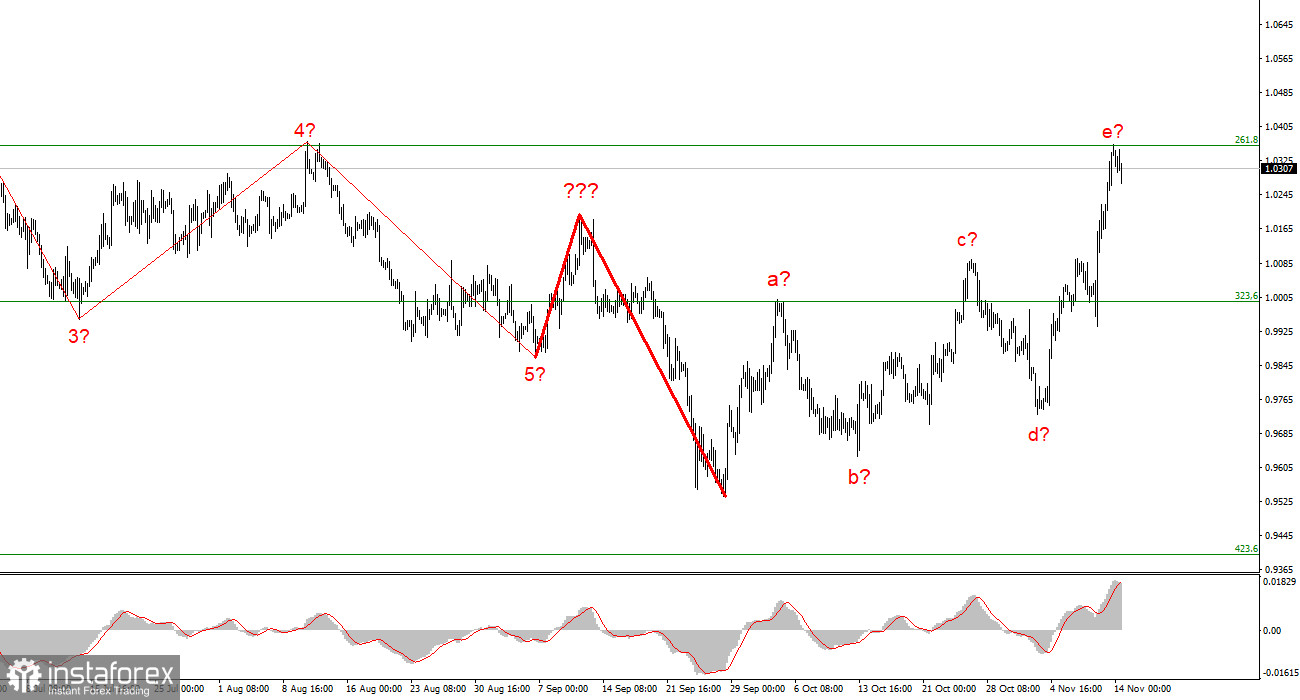
The wave marking of the 4-hour chart for the euro/dollar instrument has undergone certain changes. The upward section of the trend continues its construction, but now it takes on a pronounced corrective form. Initially, I thought that three waves would be built up, but now it is obvious that there are five waves. Thus, we get a complex correction structure of waves a-b-c-d-e. If this assumption is correct, then the construction of this structure may be nearing its completion since the peak of wave e exceeds the peak of wave C. In this case, we are expected to build at least three waves, but if the last section of the trend is corrective, then the next one will most likely be impulsive. Therefore, I am preparing for a new, strong decline in the instrument. An unsuccessful attempt to break through the 1.0359 mark, corresponding to 261.8% Fibonacci, will indicate the market's readiness to sell.

The most important thing now is that the wave markings of the pound and the euro coincide. If you remember, I have repeatedly warned about the low probability of a scenario in which the euro and the pound will trade in different directions. Theoretically, this is certainly possible, but it rarely happens in practice. Now both instruments are presumably building corrective trend sections, which may be completed in the near future. Thus, the British dollar may also begin to decline within the framework of a new downward trend segment.

Has the time of the euro currency passed or not yet?

The euro/dollar instrument fell by 35 basis points on Monday. It is strange, but today I did not see a strong decrease in demand for the instrument, although such a scenario suggested itself after last week when the increase was several hundred points. Let me remind you that last week, not only the report on US inflation caused panic in the foreign exchange market but also several speeches by FOMC members, who hinted with all their might that the Fed would begin to slow down the pace of rate hikes in the near future. Together, these two factors caused a strong decline in demand for the US currency. However, a new week has begun, and the market needs new growth or decline factors.

Currently, the wave pattern for the euro currency is close to ideal. Five upward correction waves were built, so at least a three-wave downward correction structure should be built. An unsuccessful attempt to break through the level of 261.8% indirectly indicates the readiness of the market for sales. However, as I have already said, the instrument practically stayed the same on Monday. The day is certainly still ongoing, but a successful attempt to break the 1.0359 mark will announce that the market is buying again. Today's only event was the release of the September report on industrial production in the European Union. Its value is 0.9% mom and 4.9% y/y. The market expected a weaker value but, at the same time, did not react to it in any way. The increase in quotations began later and looks very dangerous for the current wave markup. If the high demand for the euro continues, this may lead to a complication of the already upward trend section, which has recently begun.

This image is no longer relevant

General conclusions.

Based on the analysis, the construction of the upward trend section has become more complicated, consisting of five waves. It continues due to the inflation report and impartial statements by FOMC members. However, I cannot advise buying now since the wave marking still needs to imply a further increase. I recommend selling in case of an unsuccessful attempt to break through the 1.0359 mark with targets located near the estimated 0.9994 mark, which corresponds to 323.6% Fibonacci.

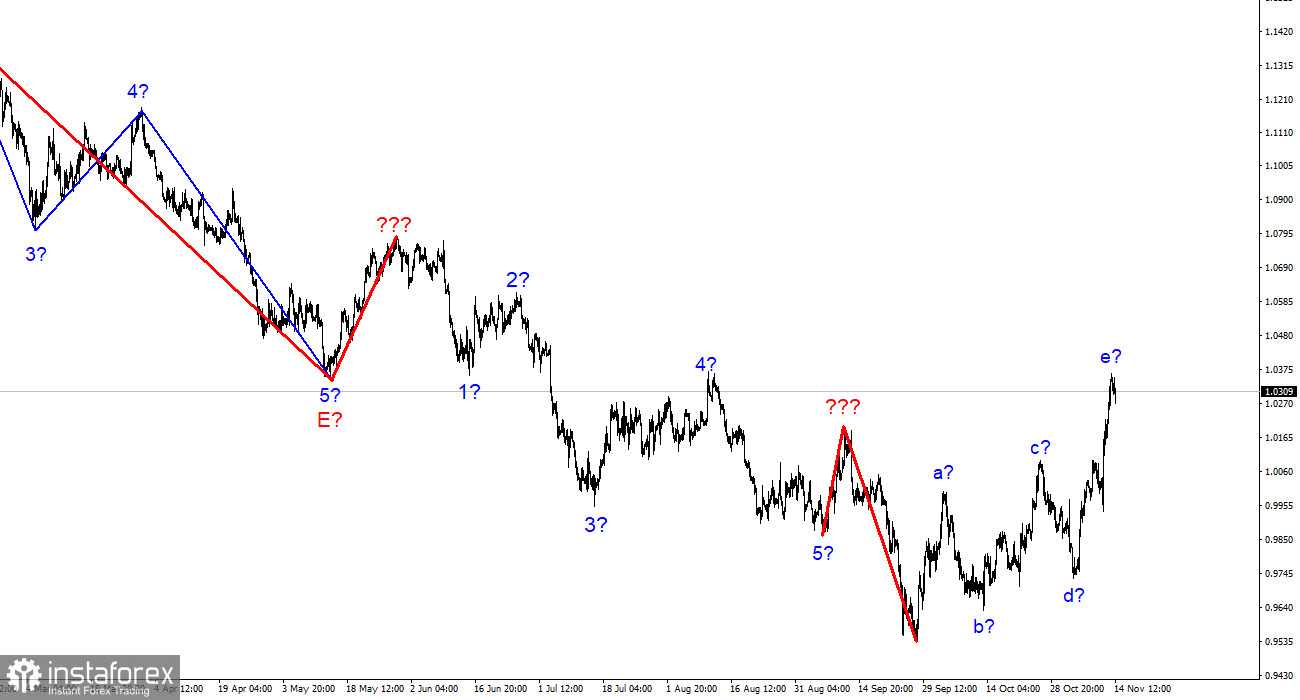
At the higher wave scale, the wave marking of the descending trend segment becomes noticeably more complicated and lengthens. We saw five upward waves, which are most likely the a-b-c-d-e structure. The construction of a downward trend section may resume after the completion of the construction of this section.

Chin Zhao,
Esperto analista di InstaForex
© 2007-2023
EURUSD
Euro vs US Dollar
Select timeframe
5
min
15
min
30
min
1
hour
4
hours
1
day
1
week
Start trade
Start trade
  • Grand Choice
    Contest by
    InstaForex
    InstaForex always strives to help you
    fulfill your biggest dreams.
    JOIN CONTEST
  • Chancy Deposit
    Deposit your account with $3,000 and get $8000 more!
    In March we raffle $8000 within the Chancy Deposit campaign!
    Get a chance to win by depositing $3,000 to a trading account. Having fulfilled this condition, you become a campaign participant.
    JOIN CONTEST
  • Trade Wise, Win Device
    Top up your account with at least $500, sign up for the contest, and get a chance to win mobile devices.
    JOIN CONTEST
  • 100% Bonus
    Your unique opportunity to get a 100% bonus on your deposit
    GET BONUS
  • 55% Bonus
    Apply for a 55% bonus on your every deposit
    GET BONUS
  • 30% Bonus
    Receive a 30% bonus every time you top up your account
    GET BONUS

Recommended Stories

Analisi EUR/USD. 30 gennaio. La settimana è iniziata con calma, tutto il più interessante è avanti

La marcatura delle onde del grafico a 4 ore per lo strumento Euro/Dollaro non è cambiata affatto ultimamente e rimane complessa. La sezione rialzista del trend è diventata correttiva (sebbene

Chin Zhao 09:39 2023-01-30 UTC+2

Analisi EUR/USD. 3 gennaio. L'inflazione in Germania e finora tutto qui...

La marcatura delle onde del grafico a 4 ore per lo strumento Euro/Dollaro sembra ancora abbastanza convincente e l'intera parte del trend rialzista rimane piuttosto complicata. Ha preso una forma

Chin Zhao 07:59 2023-01-03 UTC+2

Analisi GBP/USD. 3 gennaio. La sterlina britannica continua ad attendere notizie favorevoli.

Per lo strumento Sterlina/Dollaro, la marcatura delle onde sembra al momento piuttosto complicata, ma non necessita ancora di chiarimenti. Abbiamo una sezione di tendenza al rialzo a cinque onde

Chin Zhao 07:59 2023-01-03 UTC+2

Analisi EUR/USD. 23 dicembre. La moneta europea è andata in vacanza.

La marcatura dell'onda del grafico a 4 ore per lo strumento Euro/Dollaro sembra ancora abbastanza convincente e l'intero segmento di tendenza al rialzo continua a complicarsi. Ha già assunto

Chin Zhao 06:31 2022-12-23 UTC+2

Previsioni settimanali secondo l'analisi delle onde semplificata di GBP/USD, AUD/USD, USD/CHF, EUR/JPY, EUR/GBP, USDollar Index il 20 novembre

Nei prossimi due giorni, il prezzo della sterlina britannica dovrebbe continuare il movimento laterale lungo i confini della zona di supporto. Poi possiamo aspettarci un aumento dell'attività, un'inversione

Isabel Clark 08:17 2022-11-21 UTC+2

Analisi EUR/USD. 1 agosto. La geopolitica nel mondo si sta deteriorando di nuovo.

La tracciatura delle onde del grafico a 4 ore per lo strumento Euro/Dollaro si è complicata alcune settimane fa, ma al momento non necessita di nuovi aggiustamenti. È stato fatto

Chin Zhao 15:49 2022-08-01 UTC+2

Analisi EUR/USD. 29 luglio. L'euro ha reagito con una crescita alla debolezza del PIL statunitense

Lo strumento Euro/Dollaro prima è sceso giovedì e poi è cresciuto. Venerdì, prima è salito e poi è sceso. In generale, la valuta europea è cresciuta di 20 punti base

Chin Zhao 10:45 2022-07-29 UTC+2

Previsioni settimanali per l'analisi delle onde semplificata di EUR/USD, USD/JPY, GBP/JPY, USD/CAD, ORO il 27 luglio

Al momento non esistono condizioni per l'attività di negoziazione sul mercato dell'euro. Dopo la comparsa di segnali di inversione nella zona di supporto, gli acquisti a breve termine diventeranno possibili

Isabel Clark 10:59 2022-07-27 UTC+2

Previsione settimanale per l'analisi delle onde semplificata di EUR/USD, USD/JPY, GBP/JPY, USD/CAD, ORO e previsioni per il 13 maggio

EUR / USD Analisi: Il grafico della valuta paneuropea su larga scala è uno zigzag discendente dalla fine di gennaio 2018. Dall'inizio dello scorso anno si sviluppa la parte finale

Isabel Clark 13:19 2022-05-13 UTC+2

Analisi delle onde semplificata di GBP/USD, USD/CHF, USD/CAD e previsioni per il 29 aprile

GBP / USD Analisi: Come risultato più di annuale deprezzamento della sterlina inglese, nell'onda discendente del trend, le quotazioni sul grafico hanno raggiunto i limiti della zona di inversione potenziale

Isabel Clark 09:51 2022-04-29 UTC+2
In questo momento non potete parlare al telefono?
Ponete la vostra domanda nella chat.