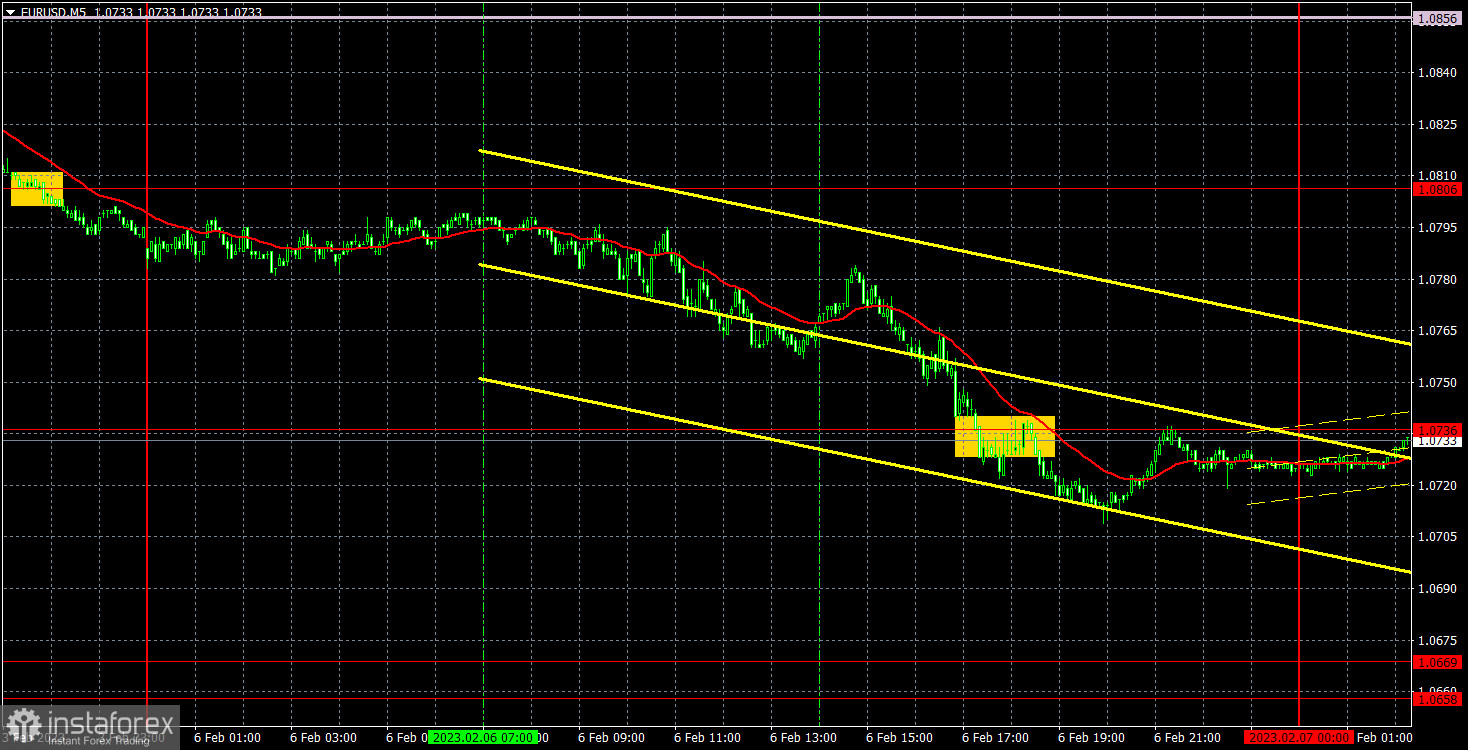
M5 chart of EUR/USD.
On Monday, the EUR/USD pair was bearish. In spite of the empty macroeconomic calendar, traders found a reason to sell the instrument. Yet, a couple of weeks ago, there was the opposite situation. Nevertheless, the eurozone saw the release of several macro reports. Thus, its services PMI rose to 46.1 in January, and retail sales dropped by 2.7% in December. However, the market showed no reaction to the results. The decline in EUR/USD came in the North American session. No macro releases were scheduled for the day in the United States. ECB President Lagarde's speech did not contain any new information or hints.
No trading signals were generated on Monday. Technically, there were two signals made. The first one was produced at the close of the market on Friday. The second one was formed on Monday night. Neither of them should have been priced. So, no positions were opened. Unfortunately, a good price movement on Monday was missed.
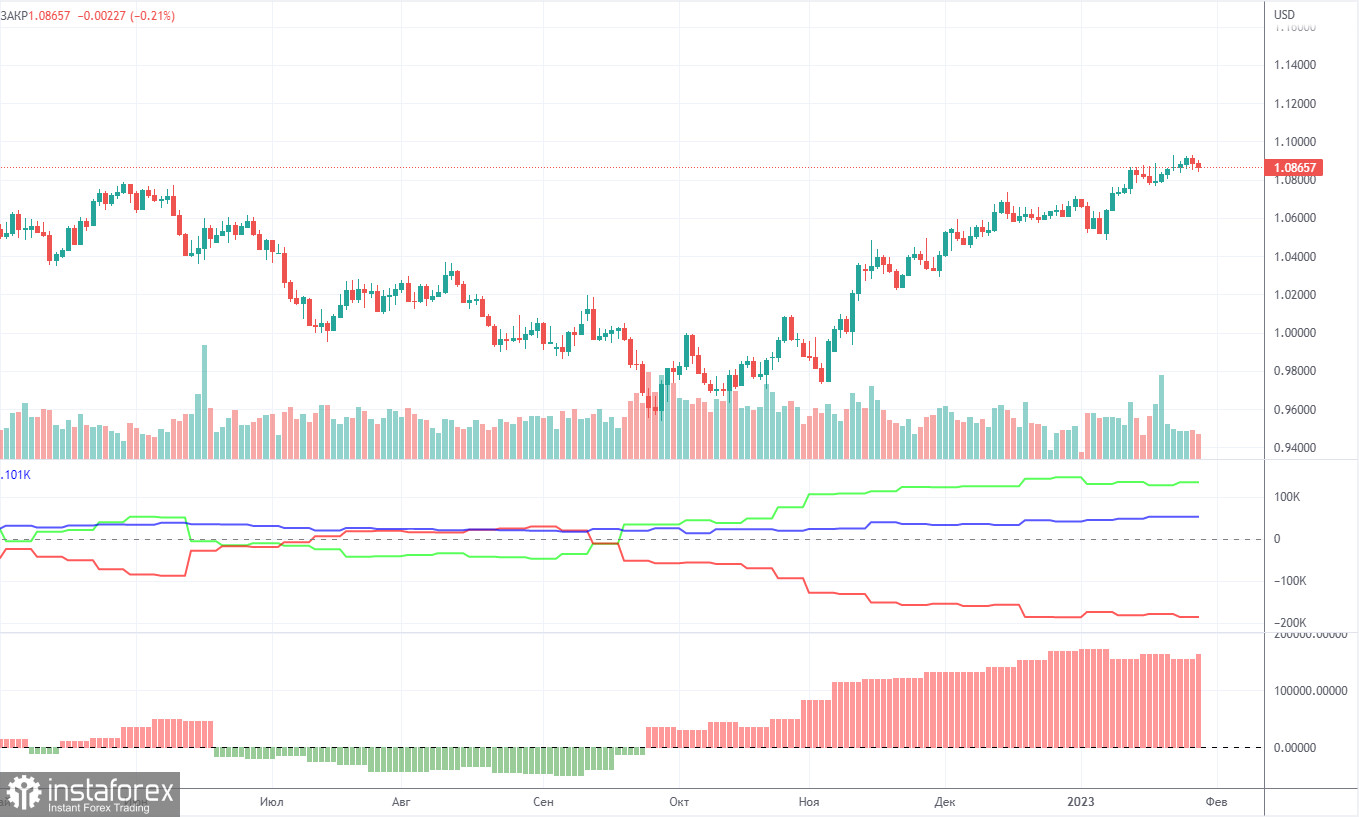
COT report:
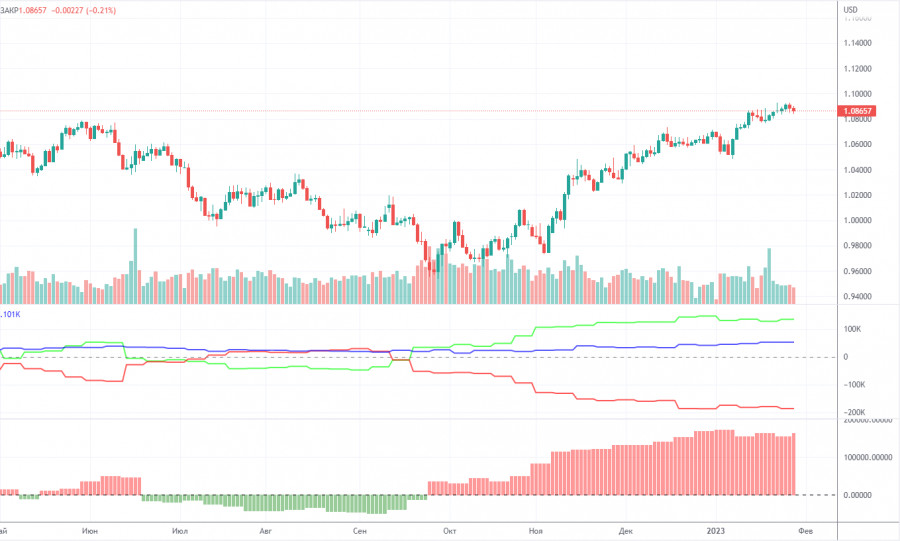
The COT reports on EUR/USD have been in line with expectations in recent months. The net non-commercial position has been on the rise since September. The bullish non-commercial position rises with each new week. Taking into account this fact, we may assume that the uptrend will soon come to an end. The red and green lines of the first indicator are far apart, which is usually a sign of the end of a trend. In the reporting week, non-commercial traders opened 9,500 long positions and 2,000 short ones. The net non-commercial position grew by 7,500. The number of long positions exceeds that of short ones by 134,000. It now remains to be seen how long large traders will be bullish. From the technical point of view, a bearish correction should have already occurred. Traders will unlikely stay bullish for another 2 or 3 months. Even the net non-commercial position shows that it is time for a correction. In total, there are 52,000 more long positions now among all groups of traders (732,000 vs 680,000).
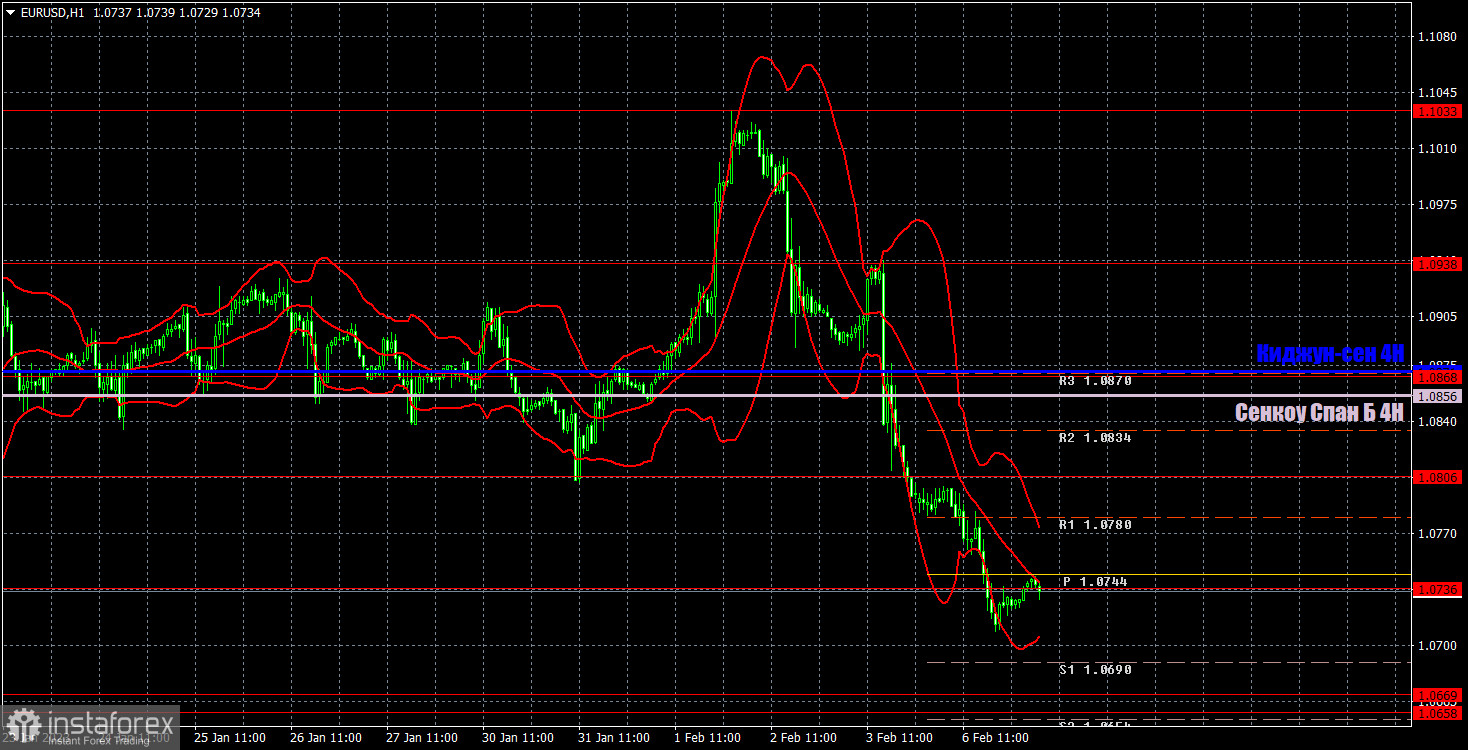
H1 chart of EUR/USD.
According to the H1 time frame, the pair is in a downtrend without any correction. On Monday, volatility somewhat decreased. The pair may tumble by 200-300 pips today. The tightening factor was priced by the market in December and January. On Tuesday, important levels are seen at 1.0485, 1.0581, 1.0658-1.0679, 1.0736, 1.0806, 1.0868, and 1.0938 as well as Senkou Span B (1.0856) and Kijun-sen (1.0871). Ichimoku indicator lines can move intraday, which should be taken into account when determining trading signals. There are also support and resistance although no signals are made near these levels. They could be made when the price either breaks or rebounds from these extreme levels. Don't forget to place Stop Loss at the breakeven point when the price goes by 15 pips in the right direction. In case of a false breakout, it could save you from possible losses. On February 7, the ECB's Isabel Schnabel and the Fed's Jerome Powell will deliver speeches. However, both policymakers are unlikely to share some new information since both central banks held their board meetings only last week. Therefore, the market will pay little attention to the officials' speeches.
Indicators on charts:
Resistance/support - thick red lines, near which the trend may stop. They do not make trading signals.
Kijun-sen and Senkou Span B are the Ichimoku indicator lines moved to the hourly timeframe from the 4-hour timeframe. They are also strong lines.
Extreme levels are thin red lines, from which the price used to bounce earlier. They can produce trading signals.
Yellow lines are trend lines, trend channels, and any other technical patterns.
Indicator 1 on the COT chart is the size of the net position of each trader category.
Indicator 2 on the COT chart is the size of the net position for the Non-commercial group of traders.