By the end of the last trading week, the pound/dollar currency pair showed even greater volatility of 294 points than the day before, resulting in an almost vertical movement. From technical analysis, we see a stunning upward move, where on average for two trading days, the quote flew almost 500 points. All the price levels on the way fell, including the correction peak of 1.2580. Parsing hourly Friday, we see that the inertial course came in the period 11:00 – 17:00 (time on the trading terminal), where all the movement of the day (294 points) was created. After that, there was a partial recovery process in the form of a small rollback of 66 points.
As discussed in the previous review, speculators could not get enough of such an intensive course for the second day in a row, where one of the most difficult tasks was in terms of fixing previously received profits. The expected resistance levels broke through under the onslaught of the inertial move, where most traders switched to the sliding stop method.
Considering the trading chart in general terms (daily period), we see that the height of the oblong correction is even greater, having from the pivot point (1.1957), already more than 700 points. The quote reached the second correction in order (1.2770 – 25.06.19), wherein the case of a move higher, the conversation could have started about a trend change, but this did not happen and the quotation started a reversal in advance. In the analysis of price behavior, it is worth taking into account such a moment that the past two days were strongly prone to panic on the background of the information flow, which in some sense could locally make a failure in the clock process of the trend.
Friday's news background did not include statistics on the UK and the United States, and they were not needed when there was such a strong information background.
So what led the quote to such a strong upward move? I hope for a bright future.
The main round of hope was born on Thursday, when at the meeting of the two leaders of Britain and Ireland, hopes of agreeing appeared. At this stage, the pound began its growth, and it is more on the emotions, but on Friday began to receive subsequent hopes. The head of the European Council Donald Tusk noted positive signals from Irish Prime Minister Leo Varadkar, against this background, the pound accelerated even more. Then came the more technical pullback as this information background is not over. Protracted negotiations between Brexit envoys Michel Barnier and Steve Barclay, in principle, have not yielded results, the EU side said that the latest proposals of Johnson could jeopardize the European market, as they do not have specifics.
In turn, British Prime Minister Boris Johnson during a government meeting on Sunday expressed hope for a deal with the European Union in the deadline set for October 31. Simultaneously with Johnson, there was news from Europe, where German Chancellor Angela Merkel during talks with French President Emmanuel Macron said: "We are in a decisive phase in the issue of Britain's exit from the European Union." At the same time, politicians stressed that Germany and France have yet to agree on their positions.
That's the stormy background that kept us going last week, but I think that's just the beginning.
Today, in terms of the economic calendar, we do not have statistics, and in the United States, the day off. In terms of information background, further outbursts regarding Brexit are possible, also today Queen Elizabeth II will open a new session of the British Parliament with a throne speech.
Further development
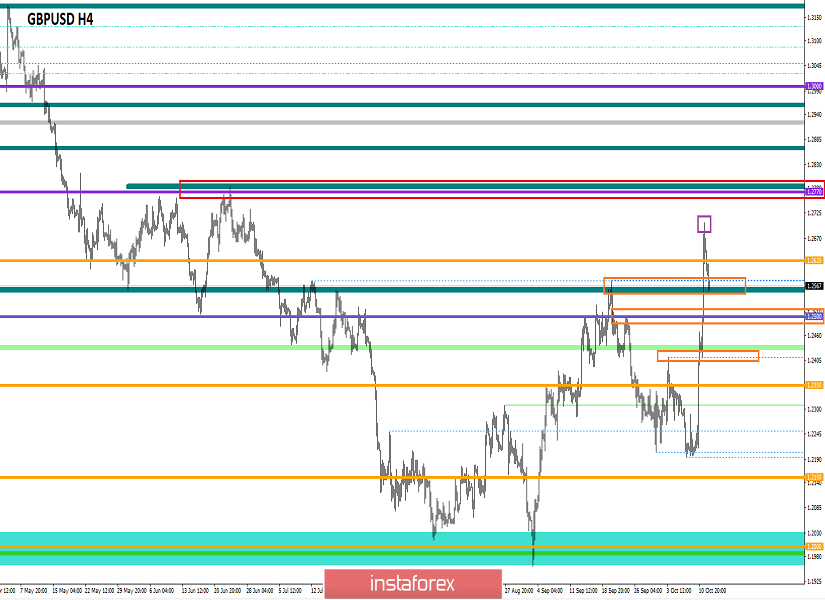
Analyzing the current trading chart, we see that the market is sluggish but still started the recovery process, going down just below the maximum of 1.2580. We see a significant overheating of long positions, which occurred due to the surge of Thursday and Friday last week. Technical correction/rollback/recovery, in this case, is necessary, unless, of course, a massive information background comes again. Detailing the beginning of the day hourly, we see that it all started with a small gap, after which a gradual downward course began, without sharp fluctuations.
In turn, speculators rolled so hard on these impulses that even sitting on the fence, in this case, is a good task, but not for everyone. The recovery process was expected by many, and, obviously, it can be earned, since the recovery in the area of 35%-50% relative to the two-day momentum is a frequent picture in this scenario.
It is likely to assume that in this case the first pivot point has already been reached, it is a peak of 1.2580, at this stage, there will be a statement of the price, perhaps in the form of a small stagnation. After that, it is worth watching the behavior of the quote and fixing points, as further recovery is possible in the direction of 1.2500 – 1.2450.
Based on the above information, we concretize trading recommendations:
- We consider purchase positions in terms of analysis, since overheating of long positions already exists. The points of possible support that are worth a closer look are 1.2580 – 1.2500 – 1.2400. It is also worth carefully monitoring the news feed, as we have already seen from the experience of last week that the information background works wonders.
- Some speculators already have selling positions in the recovery phase, you can also now look at the price fluctuations within 1.2580 since fixations lower than 1.2550 can give strength in the direction of 1.2500.
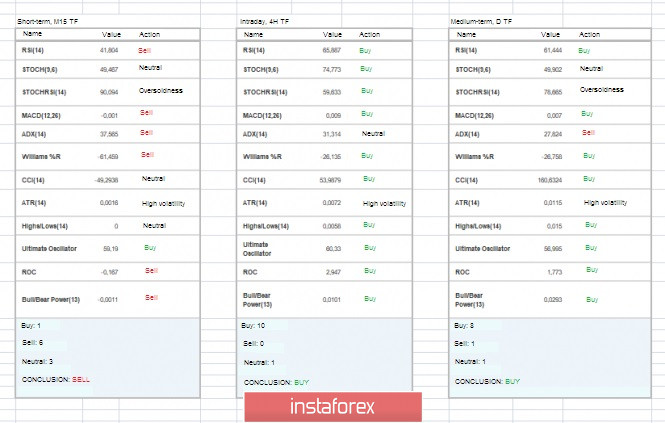
Indicator analysis
Analyzing different sector timeframes (TF), we see that indicators in the intraday and medium-term areas signal purchases due to the earlier inertial course. The short-term gap signals a recovery process that is happening at the moment.
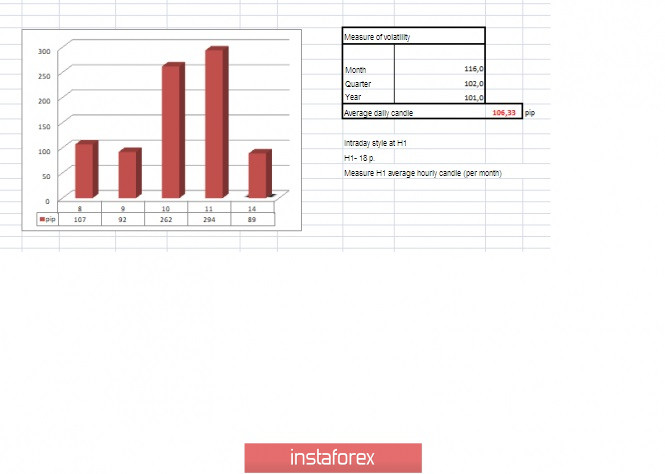
Volatility per week / Measurement of volatility: Month; Quarter; Year
Measurement of volatility reflects the average daily fluctuation, calculated for the Month / Quarter / Year.
(October 14 was built taking into account the time of publication of the article)
The volatility of the current time is 89 points, which is already quite good for this period. It is likely to assume that in the event of a continuation of the recovery process and a drop of background and emotions, volatility may continue to rise.
Key levels
Resistance zones: 1.2620; 1.2770**; 1.2880 (1.2865 – 1.2880)**.
Support zones: 1.2580*; 1.2500**; 1.2350**; 1.2205(+/-10p.)*; 1.2150**; 1.2000***; 1.1700; 1.1475**.
* Periodic level
** Range level
*** The article is based on the principle of conducting transactions, with daily adjustments.