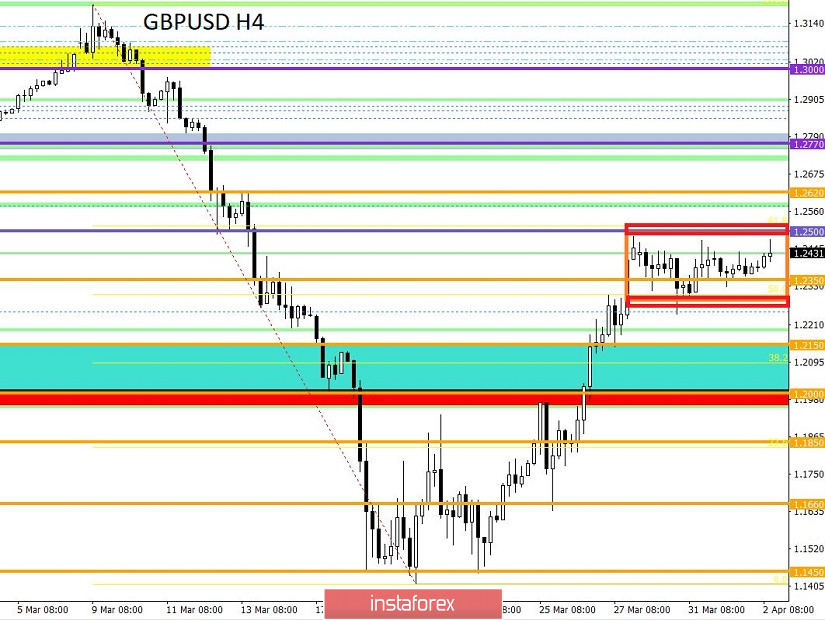
From a comprehensive analysis, we see an interesting slowdown in scale, where the market activity locally decreased below the daily average. Now, about the details. A flat formation with a scale of more than 85 hours continues to focus the special attention of market participants, where the oscillation amplitude from the frame of 1.2280/1.2480 has declined to the border of 1.2350/1.2450. We faced a consolidation relative to the end of the day, where the mirror level was the middle of the main range of 1.2280//1.2380//1.2480. If you compare the current fluctuation with the dynamics of the past month, it will be seen that this is the first significant slowdown, and the interesting thing about all this is that the external background did not affect the existing framework in any way. All this suggests that market participants are limited to possible growth, and the moment for a new round of decline has not yet come, so we have a kind of framework. Naturally, this is just a theory but supported by an external background, where the dollar looks most attractive in terms of assets.
Is it worth running and buying the dollar against the pound now? I do not think that this will be the right step since our main strategy is not a strategic position, but a local one. Thus, working on the breakdown of the main boundaries of the slowdown will be the most optimal trading tactic, which will eventually bring us profit.
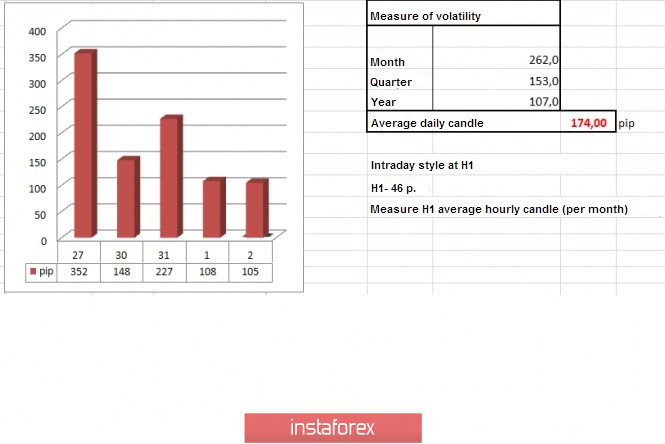
In terms of volatility, we see the first slowdown in a month and a half relative to the daily average. For example, the euro/dollar pair on the same trading day showed activity of 136 points, and the pound/dollar - 108 points, but the English currency has always been considered the most active. Resonance, I agree, but the calm before the storm was not ruled out.
Details of volatility: Monday-165 points; Tuesday-245 points; Wednesday-172 points; Thursday-358 points; Friday-359 points; Monday-144 points; Tuesday-271 points; Wednesday-676 points; Thursday-354 points; Friday-522 points; Monday-267 points; Tuesday-296 points; Wednesday-333 points; Thursday-452 points; Friday-352 points; Monday-148 points; Tuesday-227 points; Wednesday-108 points. The average daily indicator, relative to the dynamics of volatility is 174 points (see the table of volatility at the end of the article).
As discussed in the previous review, the main positions were located outside the boundaries of 1.2280/1.2480 (1.2500), but there were also local transactions, as, for example, from the value of 1.2400 for the purchase.
Looking at the trading chart in general terms (daily period), we see that at the peak of the inertial upward movement of the past week, there was a stop, which to this day slows down the quote. It is also worth noting that the upward inertia played a little more than half of the downward rally.
The news background of the past day had the ADP report on the labor market in the United States, where employment fell by 27 thousand but predicted a decline of 150-170 thousand. The discrepancy in forecasts locally kept the dollar from losing positions, and the quote remained within the slowdown.
In terms of the general information background, we see the same level of pressure from the COVID-19 virus, where new anti-records are set daily. So, as of 8 am on April 2, 29,474 cases of infection were recorded in Britain, 2,352 of which were fatal. The indicators are terrible, and the consequences of the pandemic are still ahead of us. Against such a gloomy backdrop, the United Kingdom conducted a survey among citizens of the country regarding whether the British need to postpone Brexit. The study was organized by the sociological service Focaldata, where 64% of respondents approved of extending the transition period to allow the government to focus on the fight against coronavirus. Let me remind you that the European side has already expressed a desire to postpone the deadline of December 31, 2020, to a more distant date, but no response has been received from England.
Today, in terms of the economic calendar, we have data on applications for unemployment benefits in the United States, where they are waiting for another staggering growth. So, initial applications can reach 3,180,000, and the number of repeated applications can reach 4,920,000. The US dollar may again be under local pressure.
Further development
Analyzing the current trading chart, we see the price movement within the main framework of 1.2280/1.2480 (1.2500), where the quote is concentrated within the upper limit. We are already reaching a conditional extension, where the borders will soon cease to be points of interaction of trade forces, and new bursts of activity will not take long. The main strategy that we are currently following is the method of breaking through borders. Working within the framework is possible, but it carries less revenue and more risks.
Based on the above information, we will output trading recommendations:
- Buy positions are considered higher than 1.2500 with the prospect of a move to 1.2620-1.2700.
- We consider selling positions if the price is fixed below 1.2280 with the prospect of a move to 1.2245-1.2200. The second option considers working within the range, where the positions for sale are located in the area of 1.2430, with a move towards 1.2350.
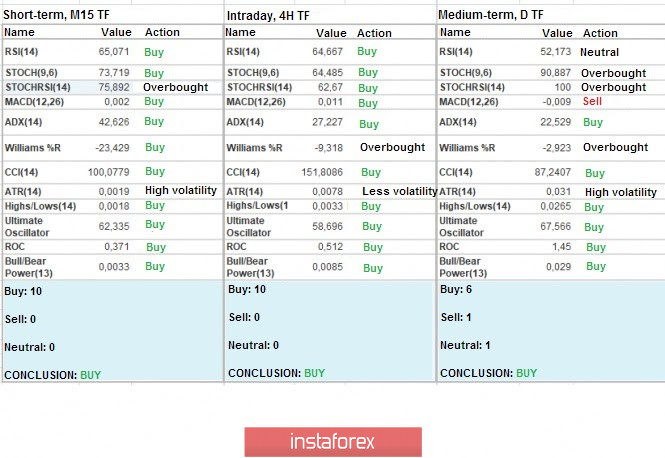
Indicator analysis
Analyzing different sectors of timeframes (TF), we see that the indicators of technical instruments, working within the range, took a variable upward position.
Volatility for the week / Measurement of volatility: Month; Quarter; Year.
Volatility measurement reflects the average daily fluctuation, calculated for the Month / Quarter / Year.
(April 2 was based on the time of publication of the article)
The volatility of the current time is 105 points, which is even less than the daily average but is almost comparable to the activity of the previous day. It is likely to assume that as soon as the main boundaries of the slowdown are broken, the activity will increase significantly.
Key levels
Resistance zones: 1.2500; 1.2620; 1.2725*; 1.2770**; 1.2885*; 1.3000; 1.3170**; 1.3300**; 1.3600; 1.3850; 1.4000***; 1.4350**.
Support zones: 1.2350**; 1.2150**; 1.2000*** (1.1957); 1.1850; 1.1660; 1.1450 (1.1411); 1.1300; 1.1000; 1.0800; 1.0500; 1.0000.
* Periodic level
** Range level
*** Psychological level
**** The article is based on the principle of conducting a transaction, with daily adjustments.