From the point of view of complex analysis, we can see a local surge in activity due to the slowdown recorded last week.
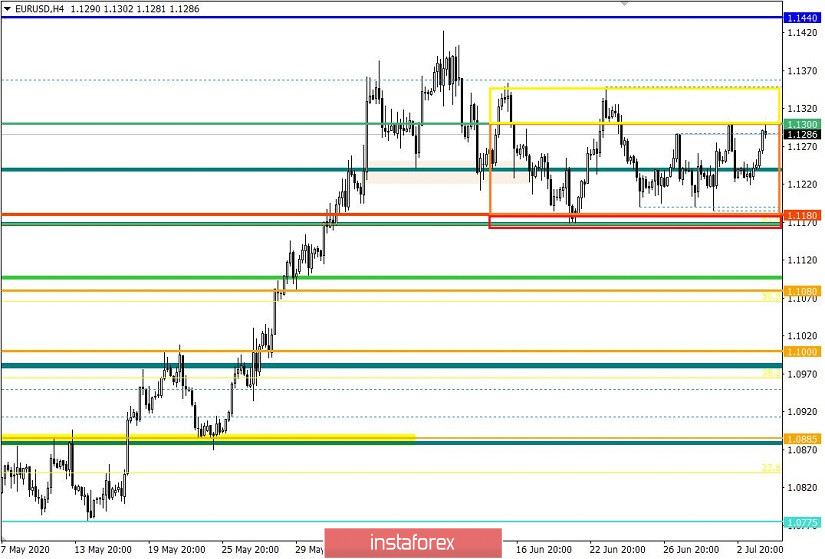
Last trading week did not lead to any major changes in the market. The quotes continued to concentrate between the values 1.1180 (1.1190) and 1.1300 (1.1350), which gradually reduced activity. The behavior of market participants also indicated ambiguity, in which the previously set downward move from the range level 1.2770 no longer played an important role in the market structure. This suggests that market participants are not yet ready for major changes, so the variable channels were formed to compress the quotes. However, such a process cannot go on forever, so sooner or later a round of activity will arise, which will lead to a breakout from the boundaries of the variable range.
Thus, the key question now is: "where exactly will the quote explode?" In all honesty, it is quite hard to pinpoint the exact direction of the quotes since the market is still under an emotional shock, which means that local operations will become the main approach, in which traders can only wait for a speculative surge in one direction or another before we can find a deal.
Key coordinates will remain to be the area of 1.1180, which, due to its borders, 1.1165 / 1.1190 confidently plays as support. Its breakdown will lead to a surge in speculative activity, which will be relative to the recovery process observed from May 18 to June 10.
If we consider the upward spiral, we will see the variable region of 1.1300 / 1.1350, the breakdown of which will lead to a surge in long positions. It will produce a local move in the direction of 1.1400-1.1440, where the area of interaction of trade forces will meet at 1.1440 / 1.1500.
Such is the side of local positions, which has the principle of a breakout. However, there are still local deals within the range, which will be discussed below.
Analyzing the trading last Friday in detail, we can see a sharp slowdown at 1.1220 / 1.1250, which was caused by the lack of trading volumes on the market due to the weekend and holiday in the United States.
Thus, volatility came out at 33 points, which is the lowest value that the indicator has recorded for 59 trading days, and is 59% lower than the average daily value. This confirms that trade volumes have decreased.
As discussed in the previous review, on Friday, traders attempted to break out the quotes from the limits 1.1220 / 1.1250, but failed. However, the deals are still relevant in this new trading week.
Analyzing the trading chart in general terms (the daily period), the slowdown process is visible, which is an intermediate phase between inertia.
As for the news published last Friday, the final data on business activity in Europe came out, in which in the service sector, the index recorded an increase from 30.5 to 48.3, and the composite PMI grew from 31.9 to 48.5.
However, there was no market reaction to the statistics.
ECB head Christine Lagarde also made a speech at an economic forum last July 4. There, she said that the world economy will change dramatically under the influence of the coronavirus pandemic.
"The current sanitary crisis will become an amplifier of those transformations that have already latently occurred in our economies. It will lead to profound changes in the entire economic system, "said Lagarde
The head of the ECB noted that the consequences of the pandemic will primarily affect industrial production, as well as the world of work and trade.
"What we have experienced will accelerate the pace of transformation and, apparently, will lead to the formation of a more ecological and more sustainable lifestyle. This will cause a change in the nature of labor for all paid workers, at least in developed countries, and will lead to the expansion of the use of digital technologies, in particular in services, to an increase in the scale of automation in industry, "She added.
Today, the data on the volume of retail sales in Europe will come out, in which experts expect a 15% growth in the index for May due to the lifting of quarantine measures. In addition, in annual terms, the decline may slow down from -19.6% to -7.5%, reflecting the recovery process, which is a good signal for investors.
In the afternoon, the ISM will publish its report on business activity in the US, in which according to forecasts, the indicator for the services sector will grow from 45.4 to 49.5 in July.
The ISM index is an important indicator of the state of the service sector in the US economy.
Further development
Analyzing the current trading chart, we can see a local surge in activity during the Asian trading session, which was caused by the accumulation last Friday, during which the quote rushed to the level of 1.1300. With regards to local operations within variable ranges, fluctuations may occur from the level of 1.1300 towards 1.1250–1.1220, which will lead to the retention of the range 1.1190 / 1.1300.
As for market sentiment, speculative positions are visible, which will definitely affect the volatility today.
Thus, if the quotes rebound from the level of 1.1300, as well as consolidate below 1.1280, the pair may move in the direction of 1.1250-1.1220.
However, an alternative scenario may occur, if the quotes move from 1.1305 towards 1.1350.
Indicator analysis
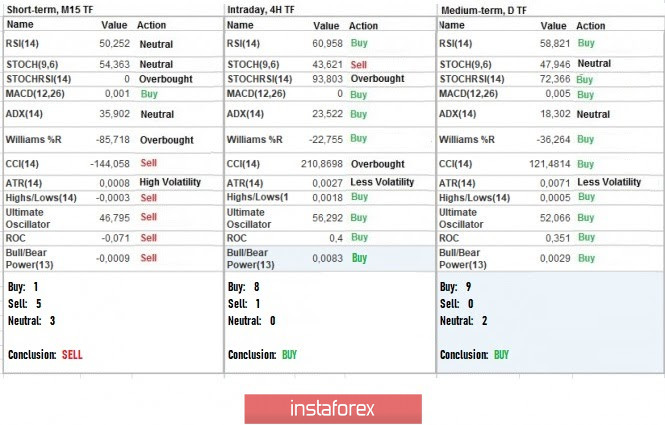
Analyzing the different sectors of time frames (TF), we can see that the indicators of technical instruments in the hourly and daily periods signal buy due to the concentration of prices in the upper part of the variable range.
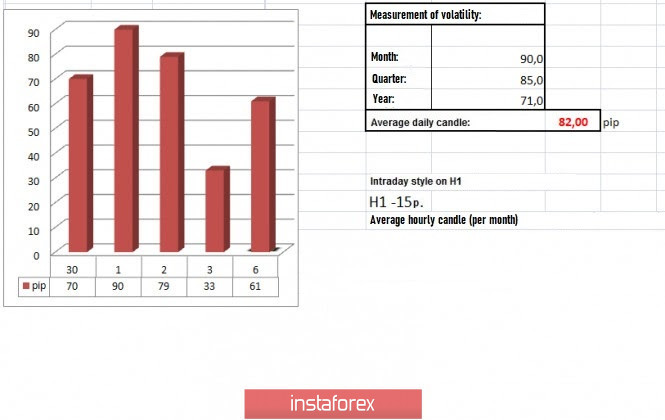
Volatility per week / Measurement of volatility: Month; Quarter Year
The measurement of volatility reflects the average daily fluctuation calculated by Month / Quarter / Year.
(July 6 was built, taking into account the time of publication of the article)
The volatility of the current time is 61 points, which is already 84% higher than the dynamics recorded last Friday. Thus, it can be assumed that the speculative mood will continue to accelerate, but the main turns of activity will occur in the coming days.
Key levels
Resistance Zones: 1.1300; 1.1440 / 1.1500; 1.1650 *; 1.1720 **; 1.1850 **; 1,2100
Support areas: 1.1180 **; 1.1080; 1,1000 ***; 1.0850 **; 1.0775 *; 1.0650 (1.0636); 1,0500 ***; 1.0350 **; 1,0000 ***.
* Periodic level
** Range Level
*** Psychological level