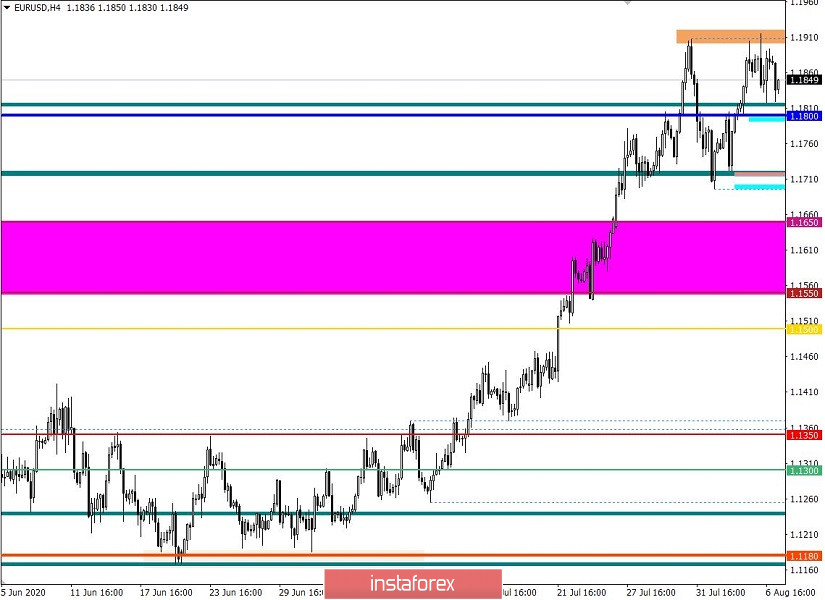
The trading week is coming to an end and it's time for us to summarize the preliminary results. The corrective move set by the market last Friday was fully played out over the next three days, where traders tried to break through the area of interaction of trading forces at 1.1900/1.1920, but the call did not give the desired results. The quote stopped, and the local maximums stopped updating. Is this the end of long-lasting upward inertia? The market participants asked.
The overbought European currency is being talked about, but the culprit of this celebration is not the euro, but the dollar, which was losing ground on all fronts of the currency market. Thus, in order to normalize the situation, the market must change its position on the US dollar, otherwise it is not the last local maximum that stands in the way of the inertial upward movement of the price.
For speculators, this situation is becoming outdated as never before, and it does not matter that the medium-term trend has changed direction. The market is simply on emotions, and that is enough.
Analyzing the past day by the minute, you can see that an attempt to break through the 1.1900/1.1920 area was recorded during the start of the European session, but there was nothing else besides the puncture by the shadows. The interaction of trade forces did their job, the volume of long positions was immediately reduced, and the euro/dollar rate pulled back towards 1.1818.
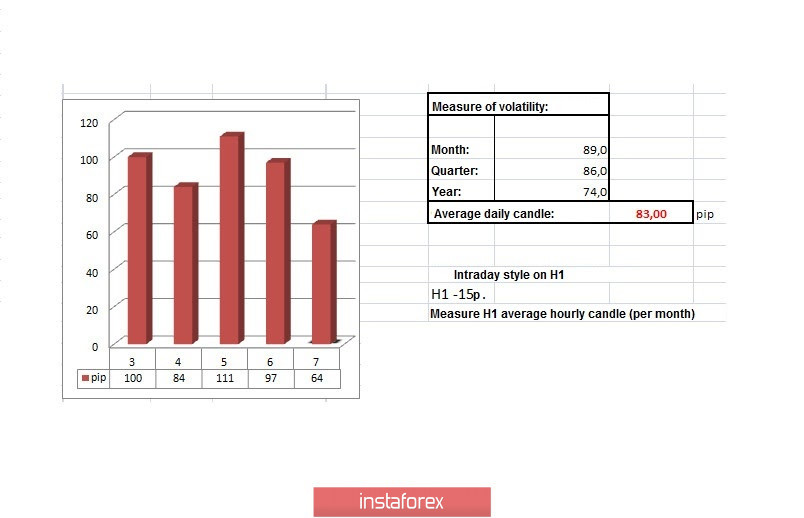
In terms of dynamics, an indicator of 97 points is fixed, which is 16% higher than the average daily value, 83 ---> 97. For a week and a half, we have been observing acceleration, where even at the time of stagnation in the market, dynamics do not decline, which indicates a high speculative excitement.
As discussed in the previous review, traders expected a price consolidation above 1.1920 to confirm a buy signal towards the psychological level 1.2000, which never happened in the market. An alternative scenario, which sees a corrective move as a possible prospect amid colossal overbought, is still relevant among traders.
Considering the trading chart in general terms (daily period), it can be seen that the quote is still on a wave of upward inertia, where the European currency has managed to gain more than 700 points, without having a corrective move since the beginning of July.
The news background of the past day included weekly data on applications for unemployment benefits in the United States, which came out better than expected. Initial applications instead of growth from 1,434,000 to 1,450,000 reflected a decrease to 1,186,000, and the number of repeated applications for benefits actually decreased by 808 thousand from 16,915,000 to 16,107,000 with the forecast of a decrease to 16,900,000.
Against such a positive background, the US dollar had a local strengthening, but not significant in terms of the overall dynamics.
In terms of the information background, we continue to monitor the excitement of politicians regarding the situation with the coronavirus infection, which has not yet been fully controlled. Members of the Fed committee talk almost on a daily basis about possible risks and an even greater slowdown in the economy if the situation with COVID-19 does not change.
"The problem with accelerating the spread of the virus is that it slowed down or somewhat muted the recovery we expected," Dallas Fed Chief, Robert Kaplan, told CNN.
Today, in terms of the economic calendar, we have a key event of the week. A report by the United States Department of Labor, which will arouse the interest of even the laziest trader.
The spotlight will be on the US unemployment rate, which is forecast to fall from 11.10% to 10.50%, which could support the US dollar if confirmed. At the same time, we should not overlook the number of new jobs created outside agriculture in July, where employment growth is expected by 1.6 million.
The upcoming trading week in terms of the economic calendar is full of macroeconomic statistics, but the final data on inflation in the US and the estimate of European GDP for the second quarter will have the greatest weight for the market.
Monday 10 August
USA 14:00 Universal time - The number of open vacancies in the JOLTS labor market, for June
Tuesday, 11 on August
USA 12:30 Universal time - Producer Price Index (PPI), for July
Wednesday 12 August
EU 9:00 Universal time - Volume of industrial production, for June
USA 12:30 Universal time - Inflation, for July
Thursday 13 August
USA 12:30 Universal time - Claims for unemployment benefits
Friday 14 August
EU 9:00 Universal time - GDP (Q2) PRELIMINARY
USA 12:30 Universal time - Volume of retail sales, for July
Further development
Analyzing the current trading chart, we can see an extremely sluggish fluctuation so far, but even with this, the quote has already managed to touch the previous day's minimum of 1.1818, which indicates a possible downward movement in terms of correction. In this difficult situation caused by the inertial movement, paired with the excitement of speculators, you should not do early actions. Considering sell positions, it is worth waiting for the price consolidation below 1.1800, which will allow a larger volume of short positions to join, which will provide less risk on deals.
Buy positions in the direction of the main inertia should be considered after price consolidates above 1.1920, in order not to fall into a turbulence of indefinite lifetime between the values of 1.1800/1.1900.
Do not forget that the vertical inertial movement cannot be eternal, and the absence of a corrective movement leads to instability of the entire structure.
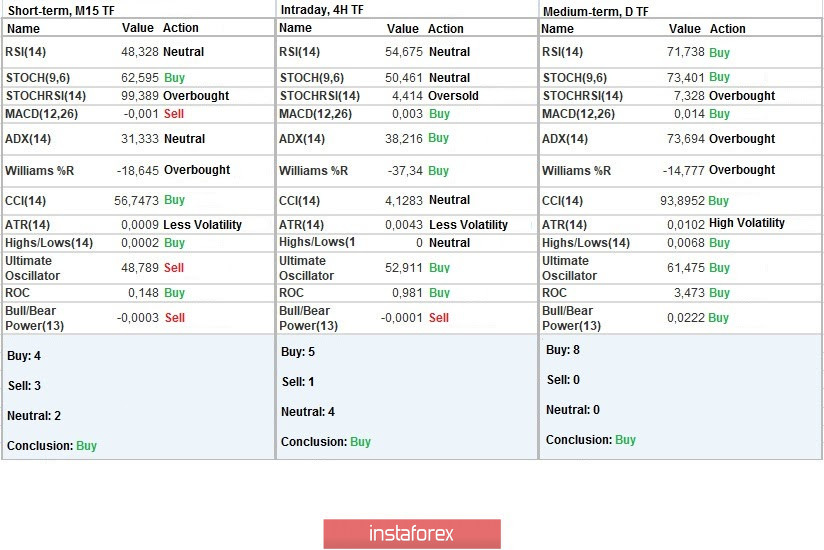
Indicator analysis
Analyzing different sectors of time frames (TF), we see that the indicators of technical instruments on the minute, hourly and daily timeframes signal a buy due to price fluctuations at the conditional maximum.
Weekly volatility / Volatility measurement: Month; Quarter; Year
Measurement of volatility reflects the average daily fluctuation, calculated per Month / Quarter / Year.
(August 7 was built taking into account the time of publication of the article)
The volatility of the current time is 64 points, which is a lot for the start of the European session. It can be assumed that, based on the report of the US Department of Labor, market volatility will continue to grow, overcoming the average threshold.
Key levels
Resistance zones: 1.1900 *; 1.2000 ***; 1.2100 *; 1.2450 **.
Support zones: 1,1800 **; 1.1650 *; 1.1500; 1.1350; 1.1250 *; 1.1.180 **; 1.1080; 1.1000 ***; 1.0850 **; 1.0775 *; 1.0650 (1.0636); 1.0500 ***; 1.0350 **; 1.0000 ***.
* Periodic level
** Range level
*** Psychological level